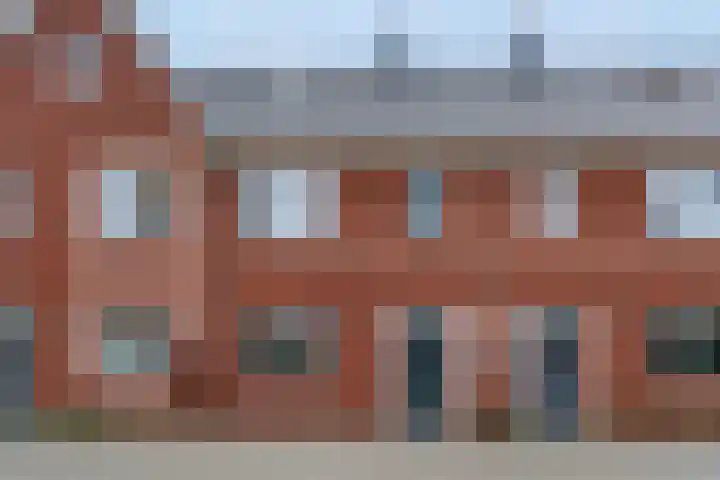
- Sold
Lichtenbeek 11
6715HM Ede
€ 675.000 k.k.
€ 4.115/m²
- Living area
- 164 m²
- Land area
- 370 m²
- Bedrooms
- 6
View 906 sold houses in Ede
Type to search. Use arrow down and arrow up to navigate through results and press Enter to open.
Hidden search suggestions.
Compare sold homes in Ede or view the current offering in this location directly.
On this page you will find recently sold homes in Ede. Use this overview to better estimate selling prices, popular neighborhoods, and the local housing supply before you choose a real estate agent. Also view the current housing supply with 1.206 houses in Ede.
6715HM Ede
€ 675.000 k.k.
€ 4.115/m²
6717EH Ede
€ 570.000 k.k.
€ 4.191/m²
6711GC Ede
€ 298.000 k.k.
€ 4.197/m²
6711XD Ede
€ 785.000 k.k.
€ 4.815/m²
6711GJ Ede
€ 525.000 k.k.
€ 4.411/m²
6717XV Ede
€ 598.000 k.k.
€ 4.397/m²
6714KD Ede
€ 375.000 k.k.
€ 2.659/m²
6711AP Ede
€ 250.000 k.k.
€ 5.555/m²
6711NK Ede
€ 475.000 k.k.
€ 4.523/m²
6711CC Ede
€ 250.000 k.k.
€ 5.813/m²
6717NN Ede
€ 595.000 k.k.
€ 3.914/m²
6717WG Ede
€ 425.000 k.k.
€ 4.047/m²
6711KP Ede
€ 398.000 k.k.
€ 4.795/m²
6717KA Ede
€ 245.000 k.k.
€ 3.550/m²
6716NA Ede
€ 455.000 k.k.
€ 4.062/m²
6714KK Ede
€ 525.000 k.k.
€ 4.200/m²
6716HK Ede
€ 445.000 k.k.
€ 3.449/m²
6717VG Ede
€ 400.000 k.k.
€ 3.738/m²
6717ZP Ede
€ 595.000 k.k.
€ 4.958/m²
6717BT Ede
€ 375.000 k.k.
€ 3.440/m²
6711VA Ede
€ 575.000 k.k.
€ 4.527/m²
6713AS Ede
€ 250.000 k.k.
€ 4.901/m²
6718LJ Ede
€ 485.000 k.k.
€ 4.409/m²
6711BT Ede
€ 285.000 k.k.
€ 3.750/m²
6714AT Ede
€ 385.000 k.k.
€ 3.407/m²
6713AL Ede
€ 325.000 k.k.
€ 4.276/m²
6711GX Ede
€ 299.000 k.k.
€ 4.671/m²
6711EK Ede
€ 575.000 k.k.
€ 3.616/m²
Get free quotes from realtors with local market knowledge in Ede.
Selling a home in Ede? Compare real estate agents who know the local housing market. Also check out all real estate agents in Ede or the top 10 real estate agents in Ede for extra context for your choice.
By comparing brokers and requesting quotes
Short answers about housing prices, sold homes and comparing real estate agents in Ede.
The costs of a real estate agent in Ede vary per office, property type and sales approach. Therefore, compare multiple quotes and also look at the real estate agents in Ede to better compare rates, presentation and local experience.
On this page we currently show 906 sold houses in Ede from our selection. This helps you to better assess recent transactions and the local housing market.
Verkochte woningen in Ede geven inzicht in vraagprijzen, woningtypes en buurten waar recent transacties hebben plaatsgevonden. Vergelijk dit ook met het actuele woningaanbod in Ede om de markt beter te duiden.
Je kunt verkochte woningen gebruiken als eerste marktindicatie, maar een lokale makelaar kan beter rekening houden met afwerking, ligging, onderhoud en actuele vraag in Ede.
Vergelijk makelaars in Ede op lokale verkoopervaring, reviews, verwachte opbrengst, courtage en marketingaanpak. De top 10 makelaars in Ede helpt om snel sterke kantoren te ontdekken.
View current location data on residents, WOZ development, housing stock, energy consumption, business activity and safety in Ede. In 2025 were there 81.700 residents. The average WOZ value in 2025 is EUR 387.539.
These figures help to better assess and compare the housing stock in Ede with recent sold homes. Orient yourself then on suitable top real estate agents in Ede for sales advice in this region.
Residents
81.700
Last year: 2025
Average WOZ
EUR 387.539
Last year: 2025
Average income per person.
EUR 31.853
Source: AllNumbers
Crimes (current year)
3.392
Total registered
| Year | Residents |
|---|---|
| 2021 | 76.765 |
| 2022 | 78.010 |
| 2023 | 79.435 |
| 2024 | 81.035 |
| 2025 | 81.700 |
| Year | Average WOZ |
|---|---|
| 2021 | EUR 268.097 |
| 2022 | EUR 291.576 |
| 2023 | EUR 340.390 |
| 2024 | EUR 365.994 |
| 2025 | EUR 387.539 |
Hoger
20.890
Praktisch
14.860
Middelbaar
24.850
Europa
4.825
Nederland
62.230
Buiten Europa
14.655
Label A
11.729
Label C
9.795
Label B
5.699
Label D
2.163
Label E
1.674
Label G
1.596
Label A++
1.456
Label A+
1.424
Label F
1.243
Label A+++
848
Label A++++
98
Label A+++++
30
| Year | Gas (m3) | Electricity (kWh) |
|---|---|---|
| 2020 | 942 | 2.754 |
| 2021 | 1.035 | 2.781 |
| 2022 | 803 | 2.610 |
| 2023 | 666 | 2.448 |
| 2024 | 640 | 2.507 |
Hoekwoning
Gas: 783 • Electricity: 2.674
Huurwoning
Gas: 497 • Electricity: 1.951
Koopwoning
Gas: 788 • Electricity: 2.770
Appartement
Gas: 415 • Electricity: 1.771
Tussenwoning
Gas: 675 • Electricity: 2.428
Vrijstaande woning
Gas: 1.228 • Electricity: 3.699
Twee-onder-één-kap woning
Gas: 981 • Electricity: 3.055
Total number of company establishments: 10.210
| Period | Crimes |
|---|---|
| jan 2025 | 285 |
| jan 2026 | 288 |
| jul 2025 | 293 |
| jun 2025 | 255 |
| mei 2025 | 252 |
| mrt 2025 | 290 |
| nov 2024 | 273 |
| nov 2025 | 313 |
| okt 2024 | 334 |
| okt 2025 | 298 |
| sep 2024 | 204 |
| sep 2025 | 269 |
These figures give an indicative picture of safety trends in the living environment of Ede.
Short answers based on current local statistics, handy for a quick comparison of the living environment.
Ede telt in 2025 ongeveer 81.700 inwoners.
De gemiddelde WOZ-waarde in Ede is in 2025 circa € 387.539.
Het gemiddelde inkomen per inwoner in Ede ligt rond € 31.853 per jaar.
Voor het huidige jaar gaat het om ongeveer 3.392 geregistreerde misdrijven. Gebruik deze cijfers als indicatie en vergelijk trends per periode.
In Ede komt vooral "Appartementen" veel voor, met ongeveer 14.755 woningen.