Residents
10.232
Last year: 2026
6961LK Eerbeek • Gelderland
€ 2.450.000 k.k.
Cost of copper (estimated): € 50.850
2% transfer tax (€ 49.000) + notary (€ 1.150) + valuation (€ 700)
Total incl. VAT: € 2.500.850
Purchase price /m²: € 6.481
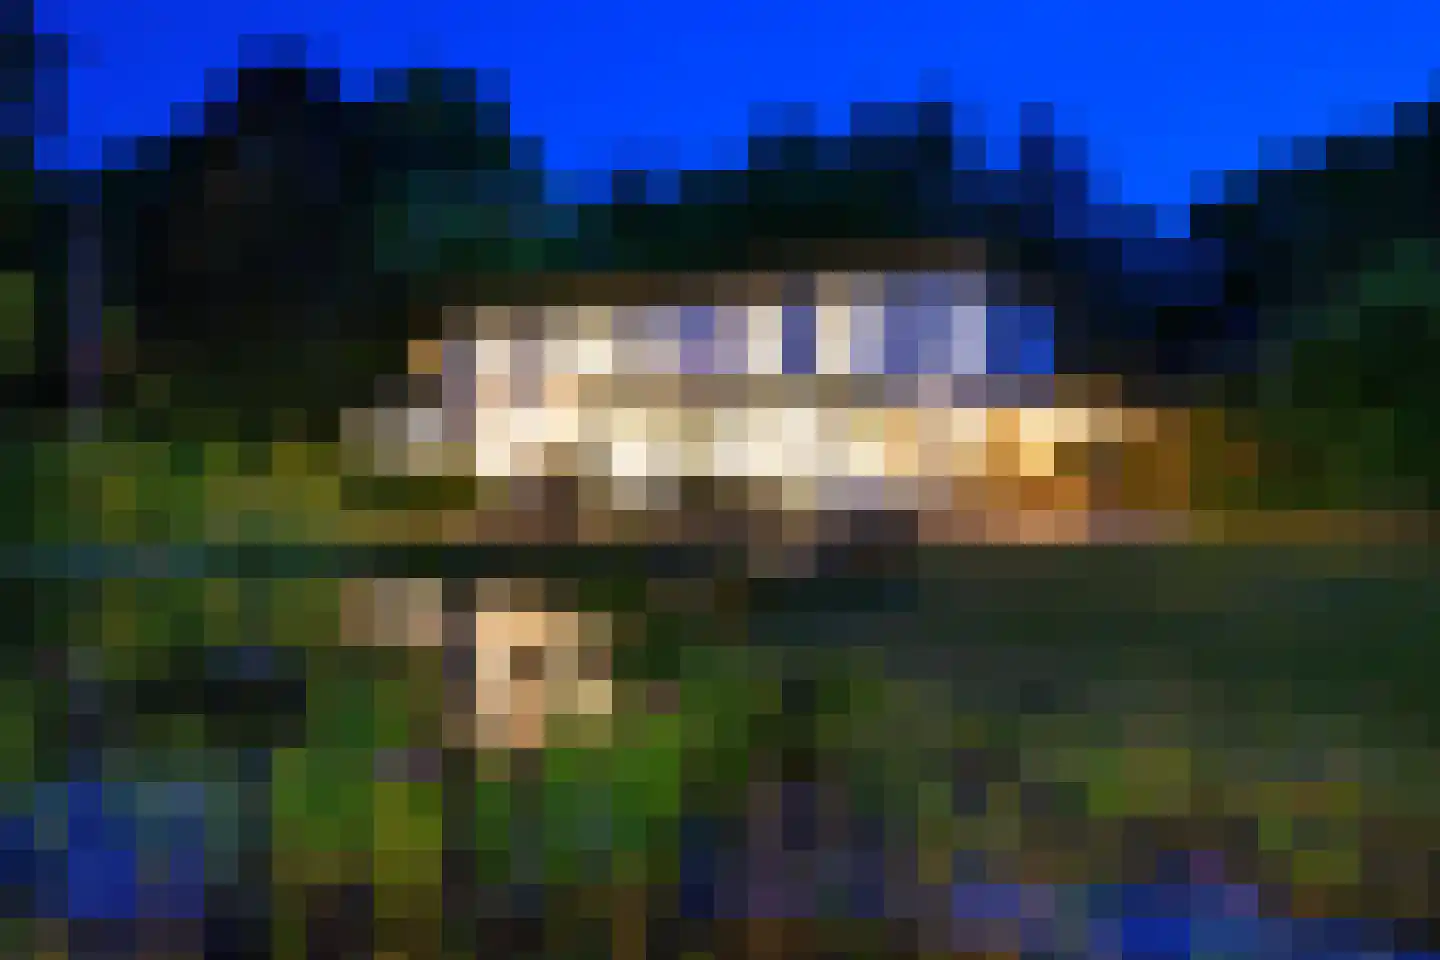
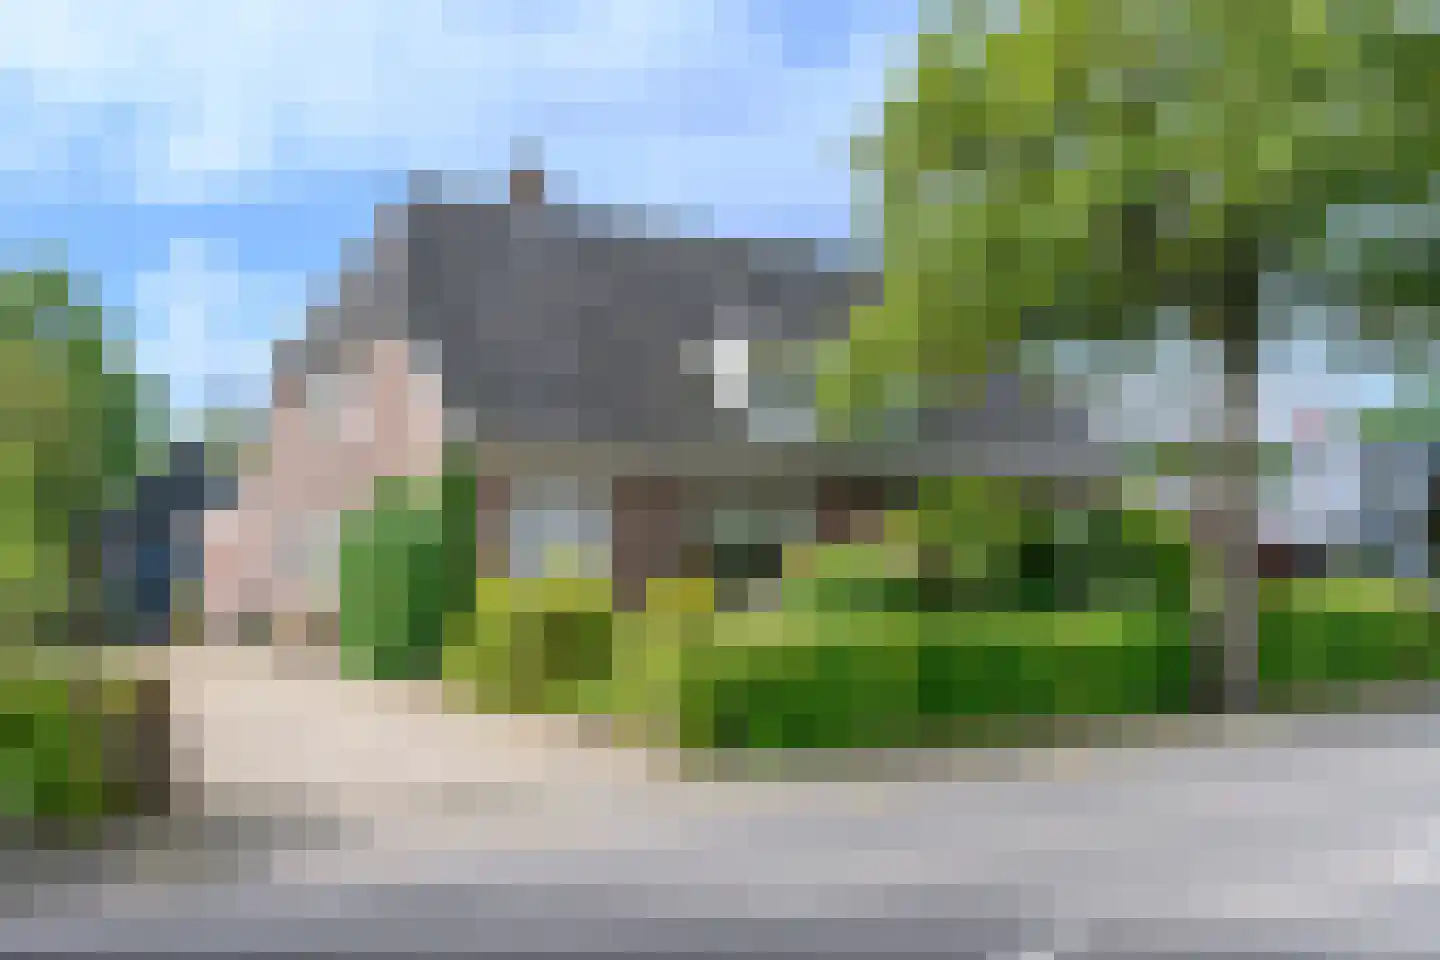
Doonweg 7 in Eerbeek, een volledig gerenoveerd vrijstaand landhuis uit 1920 met ruime bostuin van 1,4 ha, biedt historisch en comfortabel levensvermogen. Het voormalige sanatorium is na restauratie in luxe woonruimtes veranderd, inclusief een poolhouse, zwembad en geoutilleerde tuin met robotmaaiers. De woning beschikt over vloerverwarming, zonnepanelen voor elektriciteitsvoorziening, en moderne installaties als airco en alarminstallatie. Het interieur combineert hoge plafonds en grote ramen met luxe inrichtingen zoals een open haard, gashaard en sfeervolle keuken-serre-combinatie. De ligging nabij de autosnelwegen A1, A12 en A50 maakt het centraal toegankelijk voor steden als Arnhem en Apeldoorn, terwijl de lokale winkels een comfortabel leven bieden in deze groene omgeving.
€ 2.450.000
Cost of copper (estimated): € 50.850
2% transfer tax (€ 49.000) + notary (€ 1.150) + valuation (€ 700)
Total purchase (incl. p.p.): € 2.500.850
3,21%
Yearly
€ 122.500
Direct available
Estimated mortgage
Indicative gross monthly cost
Based on annuity and 30 year term
Indicative net monthly cost
iDisclaimer: this mortgage calculation is a simplified indication based on general assumptions. No rights can be derived from the results shown. Calculated with 10-annual interest (zonder NHG), automatically determined based on the price limit € 470.000. Source: 10-jaars rente uit mortgage_rates (08-06-2026 03:45). For non-NHG, an 80% mortgage of the market value has been used in this indication.
Sauna, 3 inloopdouches, 3 toiletten, vloerverwarming, 3 wastafelmeubels, en ligbad
Elektra
Explore Eerbeek and the surrounding areas
View current location data on residents, WOZ development, housing stock, energy consumption, business activity and safety in Eerbeek. In 2026 were there 10.232 residents. The average WOZ value in 2025 is EUR 380.000.
Residents
10.232
Last year: 2026
Average WOZ
EUR 380.000
Last year: 2025
Average income per person.
EUR 35.000
Source: AllNumbers
Crimes (current year)
255
Total registered
| Year | Residents |
|---|---|
| 2021 | 9.850 |
| 2022 | 9.920 |
| 2023 | 10.060 |
| 2024 | 10.215 |
| 2025 | 10.210 |
| 2026 | 10.232 |
| Year | Average WOZ |
|---|---|
| 2021 | EUR 269.000 |
| 2022 | EUR 299.000 |
| 2023 | EUR 357.000 |
| 2024 | EUR 368.000 |
| 2025 | EUR 380.000 |
Hoger
1.810
Praktisch
2.230
Middelbaar
3.420
Europa
490
Nederland
8.465
Buiten Europa
1.250
Label C
1.322
Label A
1.007
Label B
801
Label D
672
Label G
308
Label E
263
Label A+
248
Label F
246
Label A+++
183
Label A++++
96
Label A++
78
Label A+++++
5
| Year | Gas (m3) | Electricity (kWh) |
|---|---|---|
| 2020 | 1.340 | 2.880 |
| 2021 | 1.490 | 2.940 |
| 2022 | 1.150 | 2.730 |
| 2023 | 940 | 2.630 |
| 2024 | 890 | 2.720 |
Hoekwoning
Gas: 850 • Electricity: 2.430
Huurwoning
Gas: 760 • Electricity: 1.980
Koopwoning
Gas: 1.040 • Electricity: 3.000
Appartement
Gas: 700 • Electricity: 1.810
Tussenwoning
Gas: 780 • Electricity: 2.260
Vrijstaande woning
Gas: 1.440 • Electricity: 3.760
Twee-onder-één-kap woning
Gas: 970 • Electricity: 2.900
Total number of company establishments: 1.090
| Period | Crimes |
|---|---|
| jan 2026 | 14 |
| jul 2025 | 22 |
| jun 2025 | 14 |
| mei 2025 | 16 |
| mrt 2025 | 24 |
| mrt 2026 | 16 |
| nov 2024 | 16 |
| nov 2025 | 23 |
| okt 2024 | 25 |
| okt 2025 | 34 |
| sep 2024 | 11 |
| sep 2025 | 29 |
These figures give an indicative picture of safety trends in the living environment of Eerbeek.
Short answers based on current local statistics, handy for a quick comparison of the living environment.
Eerbeek telt in 2026 ongeveer 10.232 inwoners.
De gemiddelde WOZ-waarde in Eerbeek is in 2025 circa € 380.000.
Het gemiddelde inkomen per inwoner in Eerbeek ligt rond € 35.000 per jaar.
Voor het huidige jaar gaat het om ongeveer 255 geregistreerde misdrijven. Gebruik deze cijfers als indicatie en vergelijk trends per periode.
In Eerbeek komt vooral "Tussenwoningen" veel voor, met ongeveer 1.499 woningen.
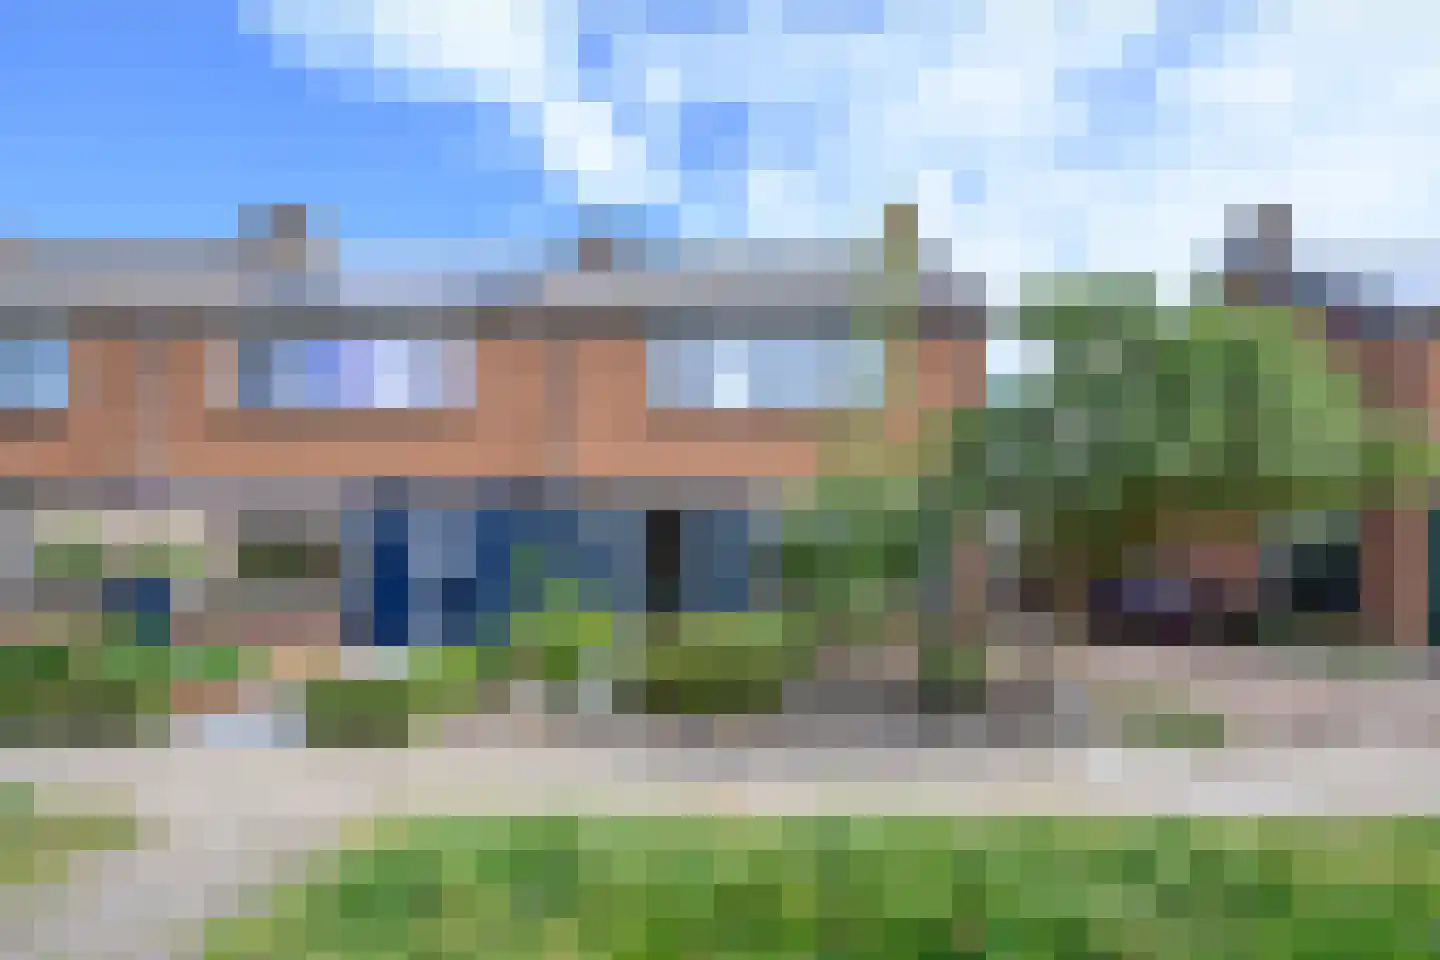
View more homes in this location.
6961LR Eerbeek
€ 975.000 k.k.
€ 5.873/m²

6961GD Eerbeek
€ 1.150.000 k.k.
€ 4.093/m²

6961LW Eerbeek
€ 645.000 k.k.
€ 5.331/m²
6961GN Eerbeek
€ 390.000 k.k.
€ 4.286/m²
6961EK Eerbeek
€ 399.000 k.k.
€ 3.912/m²
6961XR Eerbeek
€ 375.000 k.k.
€ 5.000/m²

6961AK Eerbeek
€ 459.000 k.k.
€ 3.825/m²

6961KW Eerbeek
€ 695.000 k.k.
€ 5.036/m²
