- Sold
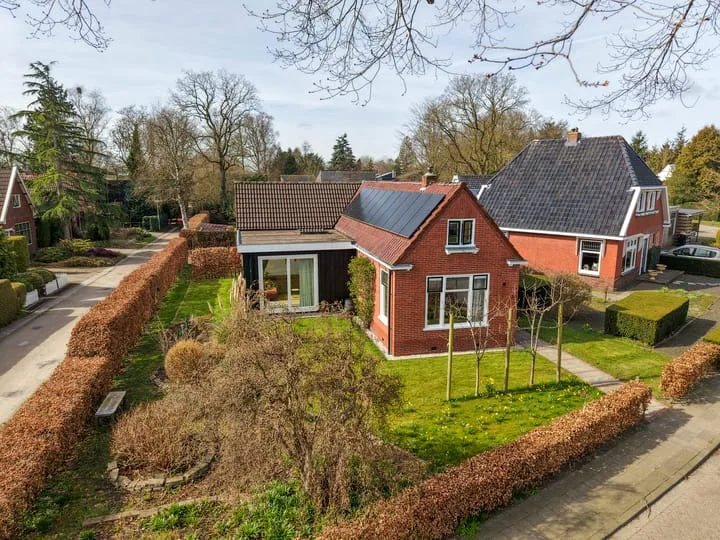
Jan Flintermanloane 4
9269VW Feanwâlden
€ 395.000 k.k.
€ 2.801/m²
- Living area
- 141 m²
- Land area
- 489 m²
- Bedrooms
- 4
View 12 sold houses in Feanwâlden
Type to search. Use arrow down and arrow up to navigate through results and press Enter to open.
Hidden search suggestions.
Compare sold homes in Feanwâlden or view the current offering in this location directly.
On this page you will find recently sold homes in Feanwâlden. Use this overview to better estimate selling prices, popular neighborhoods, and the local housing supply before you choose a real estate agent. Also view the current housing supply with 20 houses in Feanwâlden.
9269VW Feanwâlden
€ 395.000 k.k.
€ 2.801/m²
9269TM Feanwâlden
€ 450.000 k.k.
€ 3.488/m²
9269TT Feanwâlden
€ 475.000 k.k.
€ 4.702/m²
9269VJ Feanwâlden
€ 359.000 k.k.
€ 3.263/m²
9269VG Feanwâlden
€ 395.000 k.k.
€ 3.465/m²
9269VC Feanwâlden
€ 299.000 k.k.
€ 3.737/m²
9269PR Feanwâlden
€ 325.000 k.k.
€ 2.954/m²
9269PK Feanwâlden
€ 510.000 k.k.
€ 3.953/m²
9269TP Feanwâlden
€ 175.000 k.k.
€ 2.692/m²
9269WG Feanwâlden
€ 598.000 k.k.
€ 3.020/m²
9269VH Feanwâlden
€ 319.000 k.k.
€ 3.505/m²
9269TJ Feanwâlden
€ 450.000 k.k.
€ 3.000/m²
View recent sales and receive free quotes from local real estate agents. Compare more than 16 real estate agents in Feanwâlden.
Selling your own home in Feanwâlden? Compare real estate agents in Feanwâlden or view the best real estate agents in Feanwâlden as a reference for your choice.
Real estate agents make sharper offers when they know you're comparing — ask for quotes for sale or purchase.
Short answers about housing prices, sold homes and comparing real estate agents in Feanwâlden.
The costs of a real estate agent in Feanwâlden vary per office, property type and sales approach. In Feanwâlden you can compare 16 real estate agents; therefore also look at the real estate agents in Feanwâlden to better compare fees, presentation and local experience.
On this page we currently show 12 sold houses in Feanwâlden from our selection. This helps you to better assess recent transactions and the local housing market.
Houses sold in Feanwâlden give insight into asking prices, house types and neighborhoods where recent transactions have taken place. Compare this also with the current housing stock in Feanwâlden to better understand the market.
You can use sold homes as a first market indication, but a local real estate agent can better take into account finishing, location, maintenance and current demand in Feanwâlden.
Compare the 16 real estate agents in Feanwâlden on local sales experience, reviews, expected yield, commission and marketing approach. View real estate agents in Feanwâlden or the top 10 agents in Feanwâlden to quickly discover strong offices.
View current location data on residents, WOZ development, housing stock, energy consumption, business activity and safety in Feanwâlden. In 2026 were there 3.635 residents. The average WOZ value in 2025 is EUR 306.628.
These figures help to better assess and compare the housing stock in Feanwâlden with recent sold homes. Orient yourself then on suitable top real estate agents in Feanwâlden for sales advice in this region.
Residents
3.635
Last year: 2026
Average WOZ
EUR 306.628
Last year: 2025
Average income per person.
EUR 29.904
Source: AllNumbers
Crimes (current year)
73
Total registered
| Year | Residents |
|---|---|
| 2021 | 3.600 |
| 2022 | 3.590 |
| 2023 | 3.605 |
| 2024 | 3.580 |
| 2025 | 3.595 |
| 2026 | 3.635 |
| Year | Average WOZ |
|---|---|
| 2021 | EUR 212.261 |
| 2022 | EUR 246.079 |
| 2023 | EUR 288.534 |
| 2024 | EUR 296.287 |
| 2025 | EUR 306.628 |
Hoger
660
Praktisch
670
Middelbaar
1.170
Europa
85
Nederland
3.250
Buiten Europa
260
Label C
501
Label B
394
Label A
297
Label D
161
Label G
141
Label F
67
Label A+
36
Label E
34
Label A+++
4
Label A++++
3
Label A++
2
Label A+++++
0
| Year | Gas (m3) | Electricity (kWh) |
|---|---|---|
| 2020 | 1.382 | 2.495 |
| 2021 | 1.542 | 2.514 |
| 2022 | 1.197 | 2.288 |
| 2023 | 986 | 2.267 |
| 2024 | 973 | 2.362 |
Hoekwoning
Gas: 1.017 • Electricity: 1.708
Huurwoning
Gas: 790 • Electricity: 1.441
Koopwoning
Gas: 1.115 • Electricity: 2.801
Appartement
Gas: 434 • Electricity: 1.263
Tussenwoning
Gas: 908 • Electricity: 1.569
Vrijstaande woning
Gas: 1.144 • Electricity: 2.949
Twee-onder-één-kap woning
Gas: 987 • Electricity: 2.122
Total number of company establishments: 355
| Period | Crimes |
|---|---|
| jan 2026 | 4 |
| jul 2025 | 10 |
| jun 2025 | 2 |
| mei 2025 | 9 |
| mrt 2025 | 10 |
| mrt 2026 | 6 |
| nov 2024 | 4 |
| nov 2025 | 6 |
| okt 2024 | 7 |
| okt 2025 | 4 |
| sep 2024 | 10 |
| sep 2025 | 4 |
These figures give an indicative picture of safety trends in the living environment of Feanwâlden.
Short answers based on current local statistics, handy for a quick comparison of the living environment.
Feanwâlden telt in 2026 ongeveer 3.635 inwoners.
De gemiddelde WOZ-waarde in Feanwâlden is in 2025 circa € 306.628.
Het gemiddelde inkomen per inwoner in Feanwâlden ligt rond € 29.904 per jaar.
Voor het huidige jaar gaat het om ongeveer 73 geregistreerde misdrijven. Gebruik deze cijfers als indicatie en vergelijk trends per periode.
In Feanwâlden komt vooral "Vrijstaande woningen" veel voor, met ongeveer 735 woningen.