Residents
8.645
Last year: 2025
5361HA Grave • Noord-Brabant
€ 639.000 k.k.
Cost of copper (estimated): € 14.630
2% transfer tax (€ 12.780) + notary (€ 1.150) + valuation (€ 700)
Total incl. VAT: € 653.630
Purchase price /m²: € 3.651
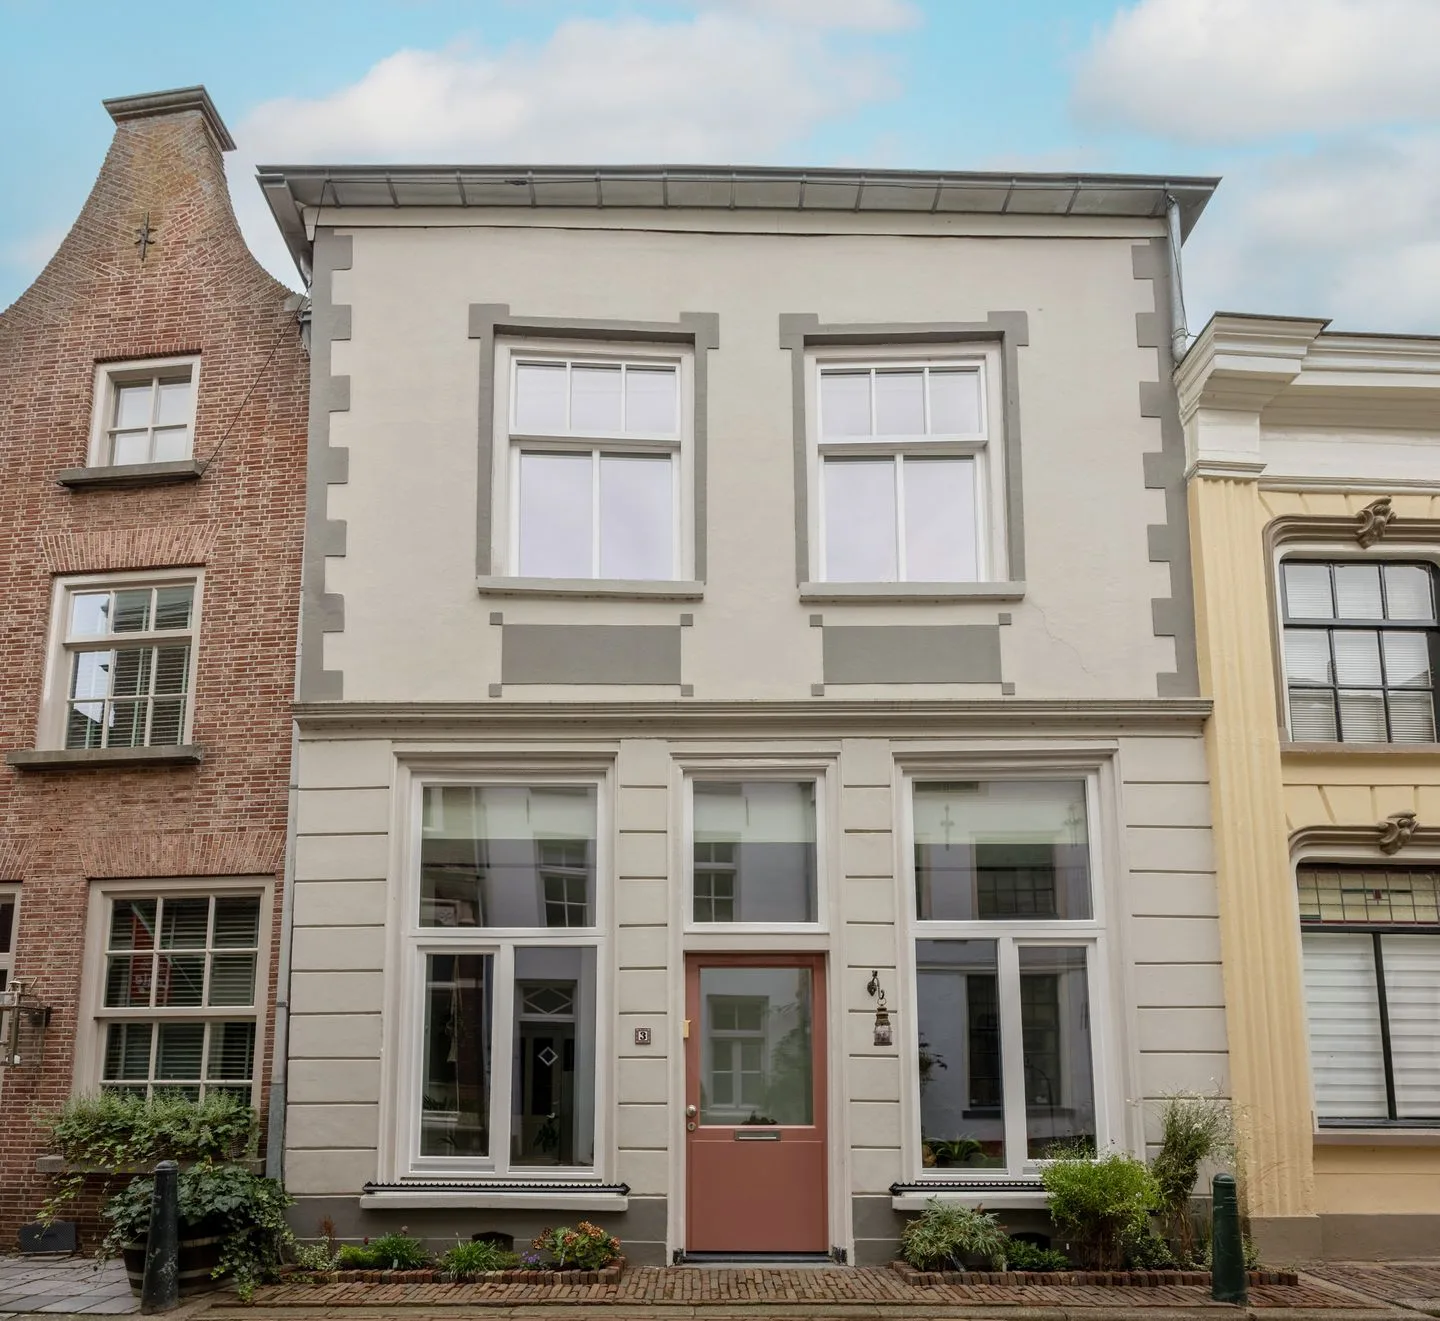
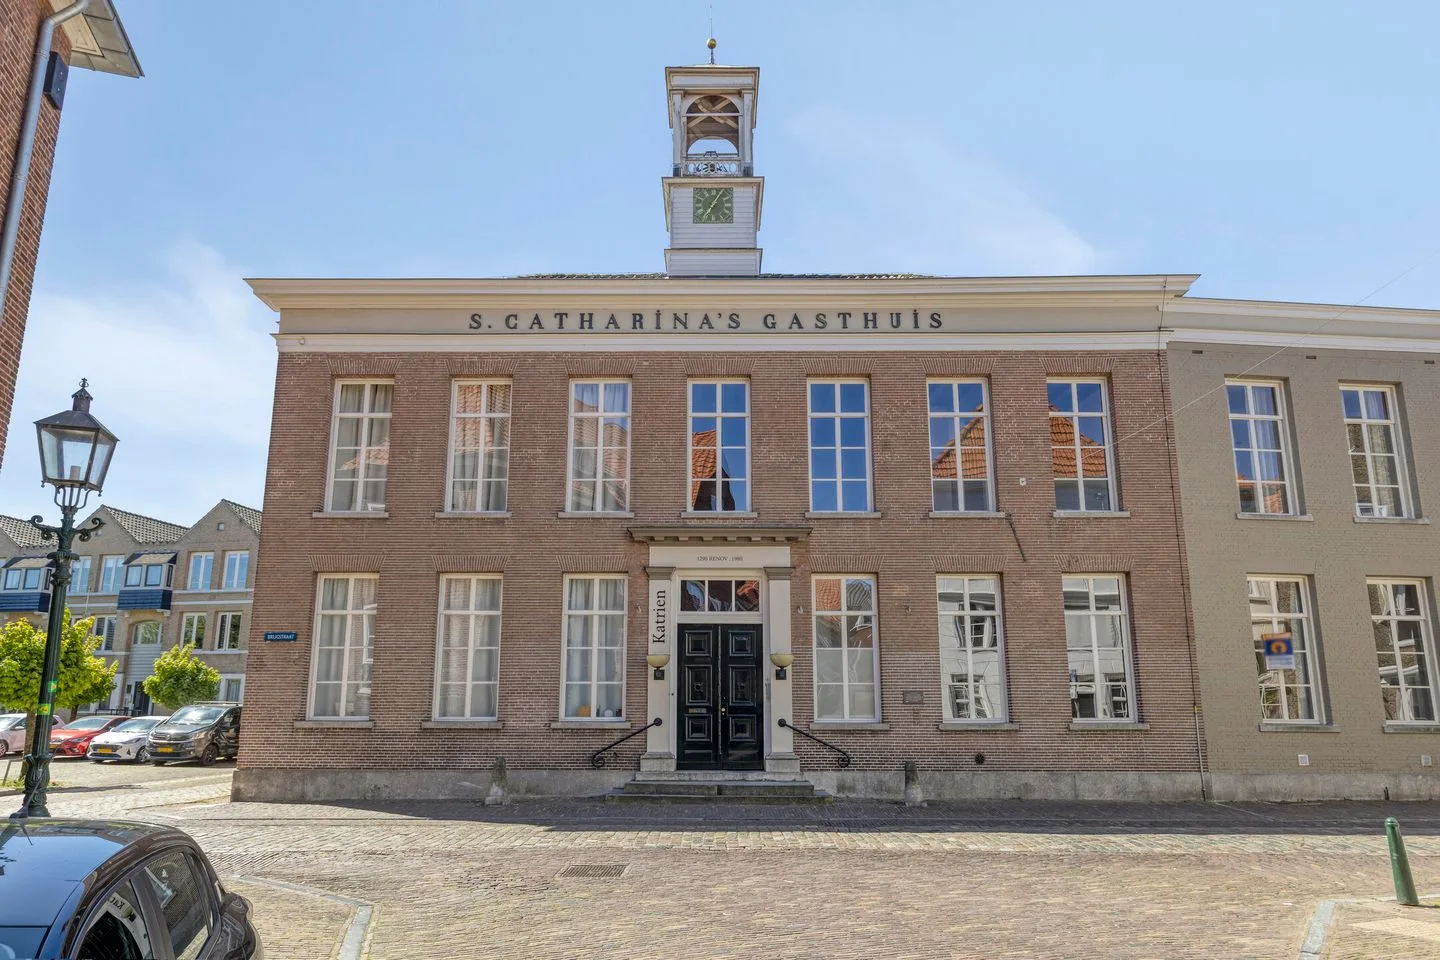
We hebben het hier over Gemeentelijk monument “De Anker” aan de Hamstraat in hartje Grave. Een prachtig en karakteristiek herenhuis uit 1680 dat volledig in stijl is gerenoveerd en sindsdien met zorg is onderhouden. Hier woon je in een stukje historie, maar met het comfort van nu. Achter de monumentale gevel vind je een warm en sfeervol huis vol licht, hoogte en karakter — een plek waar je tot rust komt, midden in het levendige centrum van Grave. De woning voelt verrassend ruim en rustig dankzij de dikke muren en het geïsoleerde glas. Overal vind je sfeervolle hoekjes om te ontspannen: in de woonkamer met hoge ramen, op het gezellige entresol, in de landelijke keuken met dakterras of juist op zolder met het grote privéterras. De keuken is met oog voor detail ingericht in 2021, voorzien van een natuurstenen blad, saliegroene kastjes en moderne apparatuur met geïntegreerde afzuiging. De badkamer is vergroot en vernieuwd en biedt nu een inloopdouche, ligbad en een royaal meubel (er is een aansluiting voor een tweede douche). Op de zolder is gekozen voor een ruime slaapkamer met schuifdeuren, veel licht en de mogelijkheid om eenvoudig twee kamers te creëren. De woning is voorzien van twee keukens. De afwerking is tot in de puntjes verzorgd. Overal is gekozen voor kwaliteit en behoud van sfeer. Zo ligt er beneden een robuuste houten vloer met planken uit de havens van Antwerpen en zijn details als drijfhouten trapleuningen een knipoog naar het vestingkarakter van Grave. Zowel binnen als buiten is het schilderwerk uitstekend onderhouden en de kozijnen en beglazing zijn vernieuwd. Het huis beschikt over twee zonnige dakterrassen: het eerste grenst aan de keuken en nodigt uit tot een praatje met de buren, terwijl het tweede terras op de bovenste verdieping volop privacy en zon biedt. Dit is het hoogste dakterras van de omliggende panden en een heerlijke plek om te ontspannen. Kortom, een uniek en sfeervol monumentaal herenhuis dat historie en hedendaags wooncomfort perfect combineert, op een van de mooiste plekken in het historische centrum van Grave. Bovendien biedt het pand mogelijkheden voor een woon-/winkelbestemming. Op dit moment wordt het uitsluitend als woning gebruikt, maar detailhandel is hier ook mogelijk: op de begane grond kan desgewenst een winkel worden gestart. Algemene informatie Woonoppervlakte circa 175 m² | Bouwjaar circa 1680 | Gemeentelijk monument Volledig gerenoveerd en uitstekend onderhouden | Cv-ketel Remeha 2020 | Grotendeels HR++ glas Voorzien van zonnepanelen | Energielabel B Twee zonnige dakterrassen | Luxe keuken met natuurstenen blad
€ 639.000
Cost of copper (estimated): € 14.630
2% transfer tax (€ 12.780) + notary (€ 1.150) + valuation (€ 700)
Total purchase (incl. p.p.): € 653.630
3,21%
Yearly
€ 31.950
Direct available
Estimated mortgage
Indicative gross monthly cost
Based on annuity and 30 year term
Indicative net monthly cost
iDisclaimer: this mortgage calculation is a simplified indication based on general assumptions. No rights can be derived from the results shown. Calculated with 10-annual interest (zonder NHG), automatically determined based on the price limit € 470.000. Source: 10-jaars rente uit mortgage_rates (08-06-2026 03:45). For non-NHG, an 80% mortgage of the market value has been used in this indication.
Inloopdouche, ligbad, en wastafel
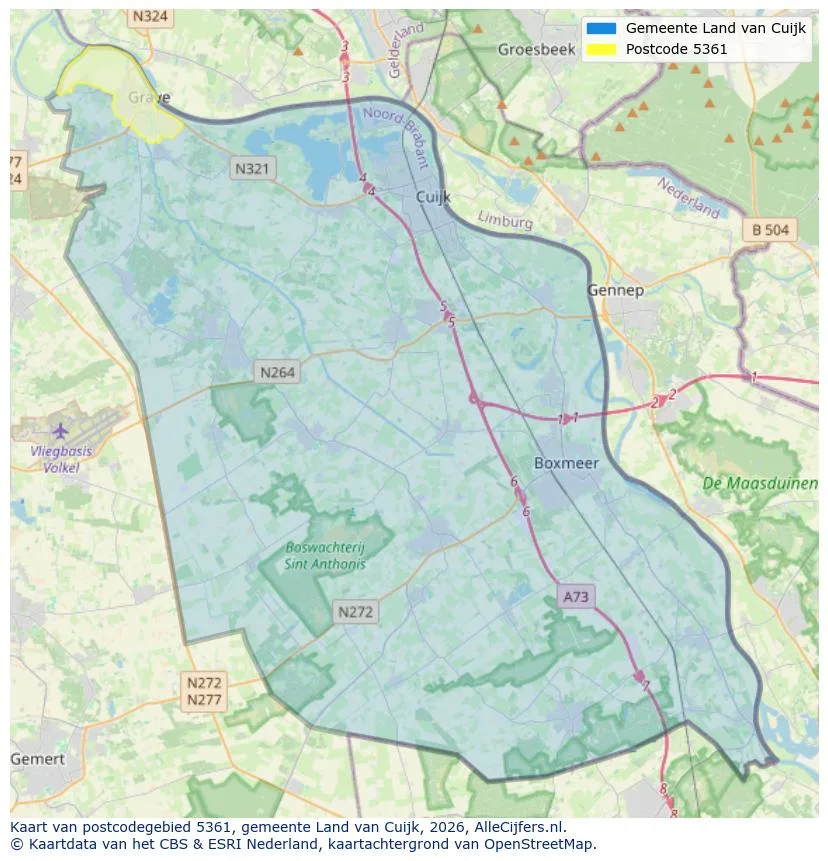
Discover where agents are active in Grave
View current location data on residents, WOZ development, housing stock, energy consumption, business activity and safety in Grave. In 2025 were there 8.645 residents. The average WOZ value in 2025 is EUR 339.000.
Residents
8.645
Last year: 2025
Average WOZ
EUR 339.000
Last year: 2025
Average income per person.
EUR 33.400
Source: AllNumbers
Crimes (current year)
289
Total registered
| Year | Residents |
|---|---|
| 2021 | 8.580 |
| 2022 | 8.550 |
| 2023 | 8.620 |
| 2024 | 8.575 |
| 2025 | 8.645 |
| Year | Average WOZ |
|---|---|
| 2021 | EUR 226.000 |
| 2022 | EUR 251.000 |
| 2023 | EUR 291.000 |
| 2024 | EUR 320.000 |
| 2025 | EUR 339.000 |
Hoger
1.720
Praktisch
1.680
Middelbaar
2.970
Europa
640
Nederland
7.140
Buiten Europa
865
Label C
1.393
Label B
814
Label A
786
Label D
398
Label E
211
Label F
196
Label G
132
Label A+++
94
Label A++
78
Label A+
48
Label A++++
5
Label A+++++
0
| Year | Gas (m3) | Electricity (kWh) |
|---|---|---|
| 2020 | 1.170 | 2.780 |
| 2021 | 1.340 | 2.790 |
| 2022 | 1.050 | 2.600 |
| 2023 | 870 | 2.450 |
| 2024 | 850 | 2.480 |
Hoekwoning
Gas: 960 • Electricity: 2.590
Huurwoning
Gas: 720 • Electricity: 1.910
Koopwoning
Gas: 950 • Electricity: 2.720
Appartement
Gas: 590 • Electricity: 1.820
Tussenwoning
Gas: 880 • Electricity: 2.460
Vrijstaande woning
Gas: 1.360 • Electricity: 3.750
Twee-onder-één-kap woning
Gas: 980 • Electricity: 2.730
Total number of company establishments: 900
| Period | Crimes |
|---|---|
| jan 2025 | 29 |
| jan 2026 | 16 |
| jul 2025 | 21 |
| jun 2025 | 15 |
| mei 2025 | 27 |
| mrt 2025 | 23 |
| nov 2024 | 20 |
| nov 2025 | 20 |
| okt 2024 | 32 |
| okt 2025 | 31 |
| sep 2024 | 48 |
| sep 2025 | 26 |
These figures give an indicative picture of safety trends in the living environment of Grave.
Short answers based on current local statistics, handy for a quick comparison of the living environment.
Grave telt in 2025 ongeveer 8.645 inwoners.
De gemiddelde WOZ-waarde in Grave is in 2025 circa € 339.000.
Het gemiddelde inkomen per inwoner in Grave ligt rond € 33.400 per jaar.
Voor het huidige jaar gaat het om ongeveer 289 geregistreerde misdrijven. Gebruik deze cijfers als indicatie en vergelijk trends per periode.
In Grave komt vooral "Tussenwoningen" veel voor, met ongeveer 1.742 woningen.
View more homes in this location.
5361TE Grave
€ 400.000 k.k.
€ 3.125/m²

5361EK Grave
€ 450.000 k.k.
€ 5.056/m²

5361EL Grave
€ 359.000 k.k.
€ 4.851/m²
5361TA Grave
€ 395.000 k.k.
€ 2.992/m²
5361JE Grave
€ 375.000 k.k.
€ 3.233/m²

5361EK Grave
€ 725.000 k.k.
€ 5.410/m²
5361GT Grave
€ 560.000 k.k.
€ 5.091/m²
5361HB Grave
€ 339.000 k.k.
€ 4.346/m²
