- Sold
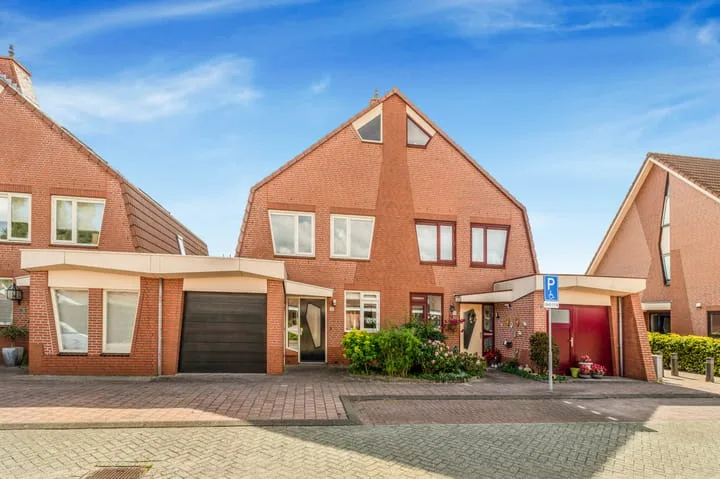
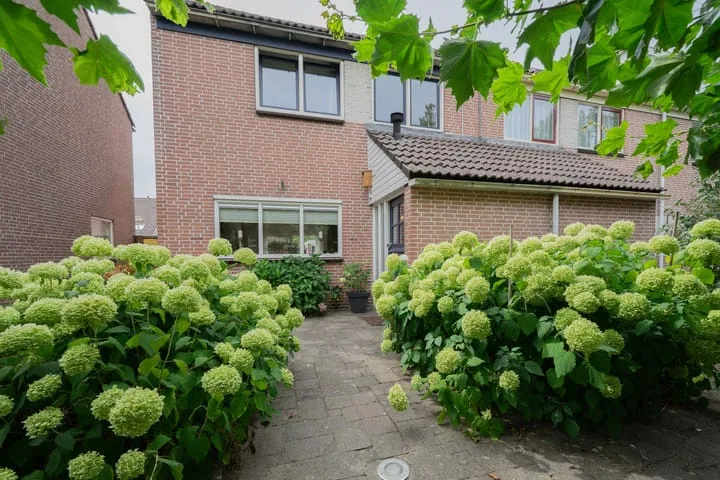
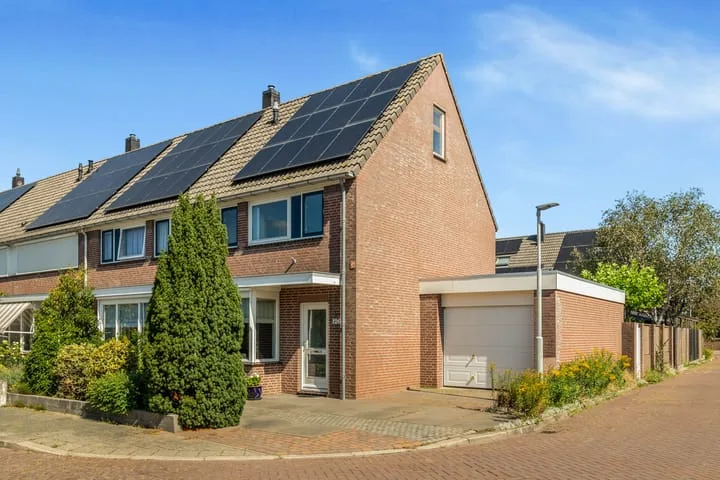
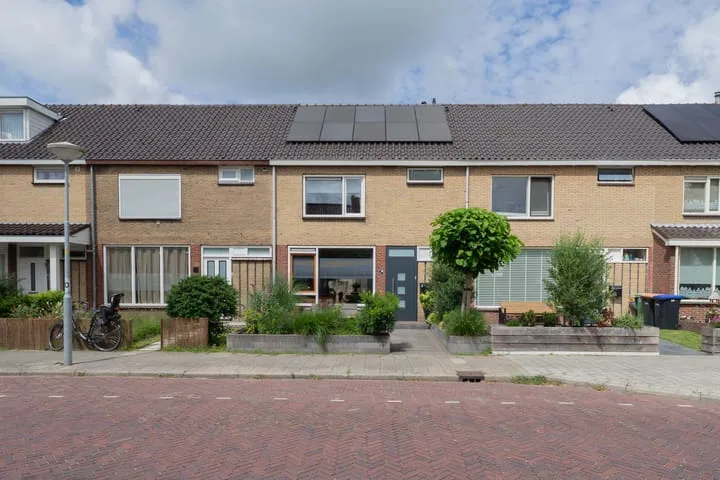
Mozartstraat 112
1962AE Heemskerk
€ 489.500 k.k.
€ 4.148/m²
A
Save as favorite
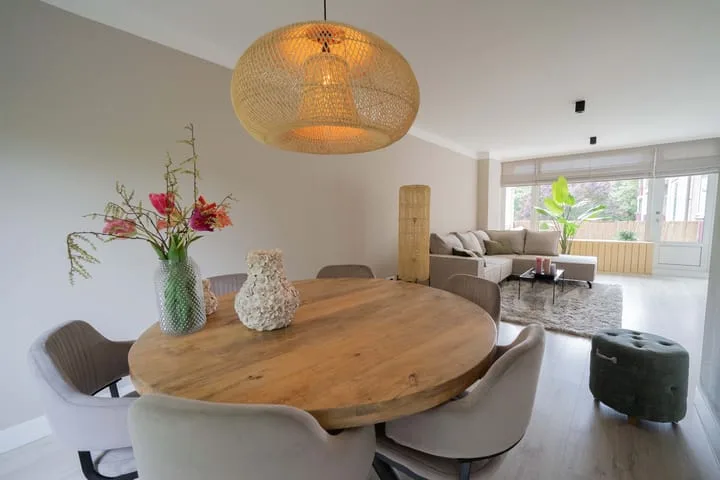
- Living area
- 118 m²
- Land area
- 155 m²
- Bedrooms
- 4