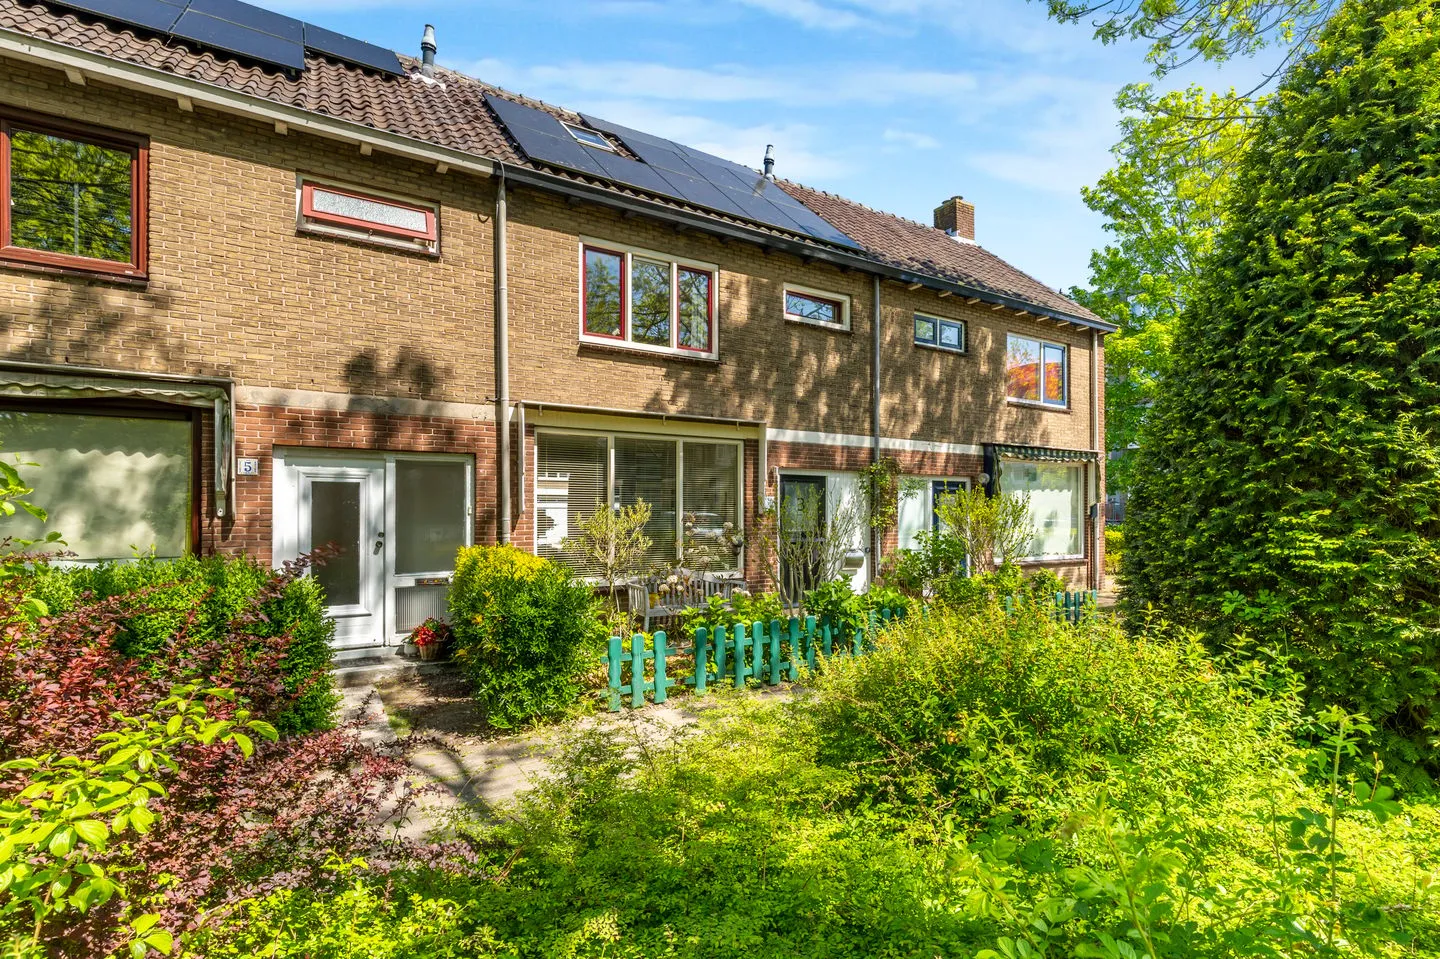
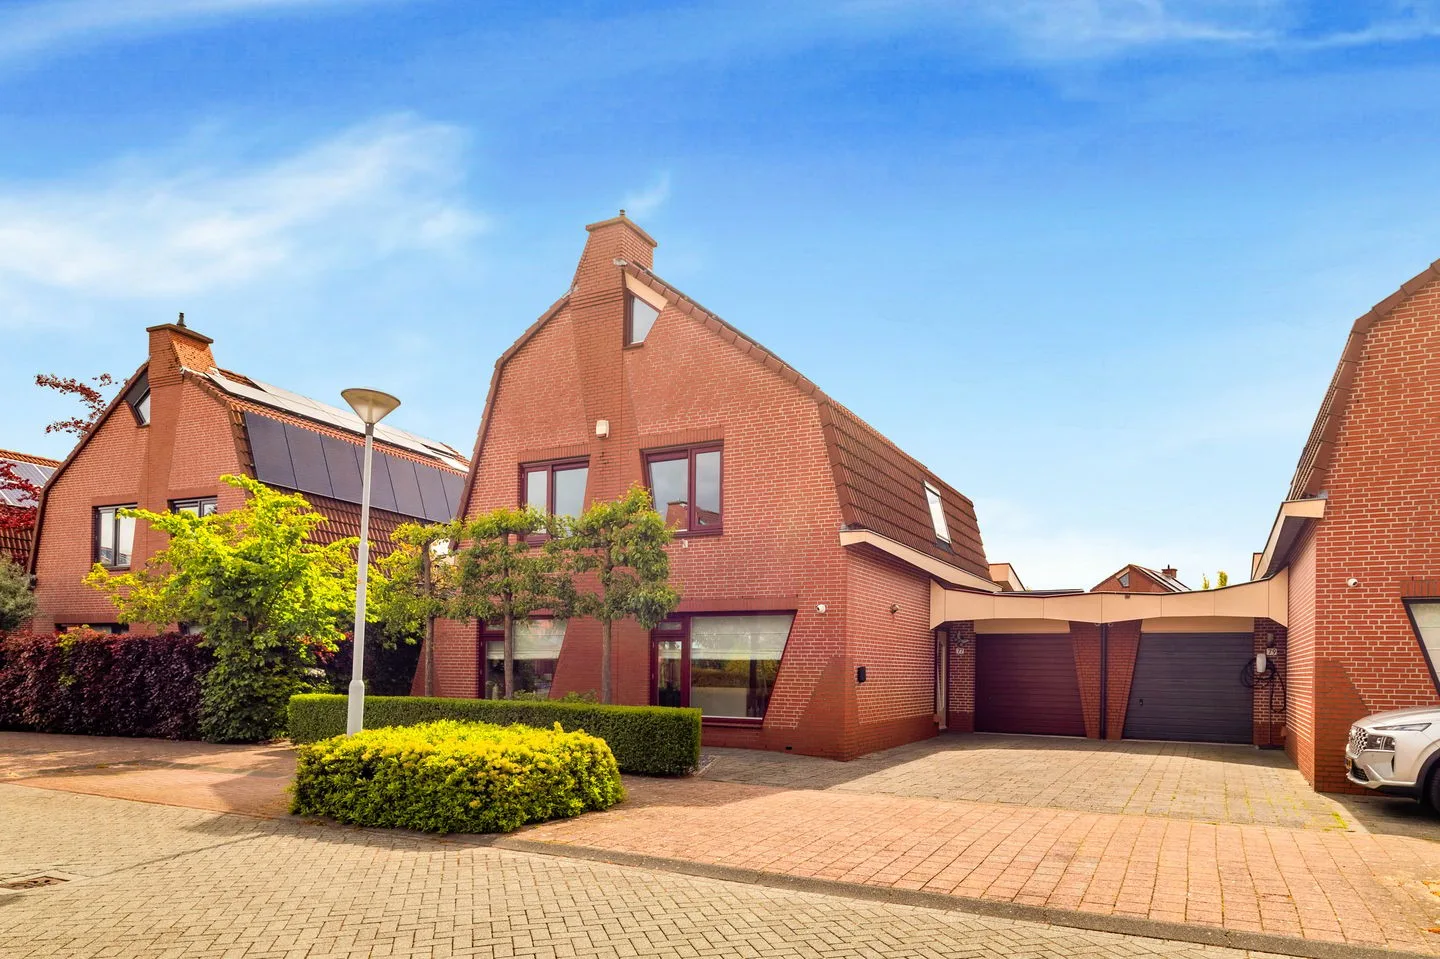
- Available
Debora Bakelaan 27
1962XM Heemskerk
€ 395.000 k.k.
€ 3.950/m²
- Living area
- 100 m²
- Land area
- 146 m²
- Bedrooms
- 4
Searching in 394 houses in Heemskerk
Type to search. Use arrow down and arrow up to navigate through results and press Enter to open.
Hidden search suggestions.
View current properties in Heemskerk or search targeted on street, postal code and property characteristics.
View the current housing stock in Heemskerk and quickly filter by price, living area, rooms and more. There are currently 394 houses in this place within our selection. View also 302 sold houses in Heemskerk for extra insight into the local housing market.
1962XM Heemskerk
€ 395.000 k.k.
€ 3.950/m²
1964CG Heemskerk
€ 40.000 k.k.
1964TD Heemskerk
€ 509.000 k.k.
€ 4.388/m²
1964HG Heemskerk
€ 39.500 k.k.
1967GG Heemskerk
€ 840.000 k.k.
€ 5.185/m²
1967JK Heemskerk
€ 850.000 k.k.
€ 5.060/m²
1967KD Heemskerk
€ 425.000 k.k.
€ 5.312/m²
1964RX Heemskerk
€ 325.000 k.k.
€ 4.333/m²
1961NW Heemskerk
€ 425.000 k.k.
€ 3.972/m²
1962AA Heemskerk
€ 469.000 k.k.
€ 3.280/m²
1964BV Heemskerk
€ 525.000 k.k.
€ 3.477/m²
1966WJ Heemskerk
€ 265.000 k.k.
€ 4.649/m²
1963BC Heemskerk
€ 525.000 k.k.
€ 4.102/m²
1964SG Heemskerk
€ 365.000 k.k.
€ 3.578/m²
1967JK Heemskerk
€ 2.000.000 k.k.
€ 6.826/m²
1969MP Heemskerk
€ 945.000 k.k.
€ 6.848/m²
1967EC Heemskerk
€ 795.000 k.k.
€ 4.344/m²
1966VG Heemskerk
€ 395.000 k.k.
€ 4.115/m²
1966WJ Heemskerk
€ 265.000 k.k.
€ 4.732/m²
1966XK Heemskerk
€ 429.500 k.k.
€ 4.170/m²
1964HS Heemskerk
€ 298.000 k.k.
€ 3.725/m²
1967KC Heemskerk
€ 615.000 k.k.
€ 3.820/m²
1965TB Heemskerk
€ 979.000 k.k.
€ 5.021/m²
1963AM Heemskerk
€ 799.000 k.k.
€ 5.667/m²
1964ES Heemskerk
€ 399.000 k.k.
€ 5.115/m²
1963DJ Heemskerk
€ 445.000 k.k.
€ 4.159/m²
1961NS Heemskerk
€ 395.000 k.k.
€ 4.938/m²
1962GG Heemskerk
€ 295.000 k.k.
€ 4.470/m²
Get free quotes from real estate agents with local market knowledge. Compare more than 62 real estate agents in Heemskerk.
Selling a home in Heemskerk? View the sales-oriented guide sell a house in Heemskerk, compare all real estate agents in Heemskerk or view the top 10 real estate agents in Heemskerk for extra context to your choice.
Real estate agents make sharper offers when they know you're comparing — ask for quotes for sale or purchase.
Practical answers about housing supply, sales and comparing real estate agents in Heemskerk.
The costs of a real estate agent in Heemskerk depend on commission, setup costs, property presentation and the chosen service. Compare the 62 real estate agents in Heemskerk via the real estate agent page and request multiple quotes to compare rates and approach well.
Within our selection, we are currently showing 394 houses in Heemskerk. View also the sold houses in Heemskerk to compare the current offering with recent transactions.
Take into account not only price and living area but also maintenance, energy label, location, outdoor space and sales status. This way you compare houses in Heemskerk on more than just the asking price.
A local real estate agent knows the neighborhoods, recent transactions and demand in Heemskerk. By comparing 62 real estate agents in the region you get a better insight into prices, sales strategy and expected yield; the top 10 in Heemskerk provides a useful starting point.
Yes, when making a sales plan, a valuation in Heemskerk is wise. You gain insight into a realistic asking price and can then compare offers from real estate agents specifically.
View current location data on residents, WOZ development, housing stock, energy consumption, business activity and safety in Heemskerk. In 2026 were there 39.532 residents. The average WOZ value in 2025 is EUR 412.000.
These figures help to better assess and compare the housing stock in Heemskerk with recent sold homes. Orient yourself then on suitable top real estate agents in Heemskerk for sales advice in this region.
Residents
39.532
Last year: 2026
Average WOZ
EUR 412.000
Last year: 2025
Average income per person.
EUR 34.600
Source: AllNumbers
Crimes (current year)
1.191
Total registered
| Year | Residents |
|---|---|
| 2022 | 39.189 |
| 2023 | 39.431 |
| 2024 | 39.452 |
| 2025 | 39.380 |
| 2026 | 39.532 |
| Year | Average WOZ |
|---|---|
| 2021 | EUR 307.000 |
| 2022 | EUR 339.000 |
| 2023 | EUR 402.000 |
| 2024 | EUR 402.000 |
| 2025 | EUR 412.000 |
Hoger
26
Praktisch
27
Middelbaar
46
Europa
2.759
Nederland
30.159
Buiten Europa
6.462
Label A
5.742
Label C
5.338
Label B
2.682
Label D
1.620
Label E
1.230
Label F
611
Label A+
465
Label G
393
Label A+++
376
Label A++
171
Label A++++
67
Label A+++++
2
| Year | Gas (m3) | Electricity (kWh) |
|---|---|---|
| 2020 | 1.080 | 2.620 |
| 2021 | 1.220 | 2.660 |
| 2022 | 940 | 2.470 |
| 2023 | 820 | 2.310 |
| 2024 | 790 | 2.340 |
Hoekwoning
Gas: 940 • Electricity: 2.580
Huurwoning
Gas: 680 • Electricity: 1.800
Koopwoning
Gas: 910 • Electricity: 2.660
Appartement
Gas: 610 • Electricity: 1.720
Tussenwoning
Gas: 830 • Electricity: 2.410
Vrijstaande woning
Gas: 1.370 • Electricity: 3.770
Twee-onder-één-kap woning
Gas: 1.130 • Electricity: 3.080
Total number of company establishments: 4.295
| Period | Crimes |
|---|---|
| jan 2025 | 116 |
| jan 2026 | 78 |
| jul 2025 | 116 |
| jun 2025 | 79 |
| mei 2025 | 98 |
| mrt 2025 | 98 |
| nov 2024 | 89 |
| nov 2025 | 73 |
| okt 2024 | 110 |
| okt 2025 | 86 |
| sep 2024 | 106 |
| sep 2025 | 146 |
These figures give an indicative picture of safety trends in the living environment of Heemskerk.
Short answers based on current local statistics, handy for a quick comparison of the living environment.
Heemskerk telt in 2026 ongeveer 39.532 inwoners.
De gemiddelde WOZ-waarde in Heemskerk is in 2025 circa € 412.000.
Het gemiddelde inkomen per inwoner in Heemskerk ligt rond € 34.600 per jaar.
Voor het huidige jaar gaat het om ongeveer 1.191 geregistreerde misdrijven. Gebruik deze cijfers als indicatie en vergelijk trends per periode.
In Heemskerk komt vooral "Tussenwoningen" veel voor, met ongeveer 7.192 woningen.