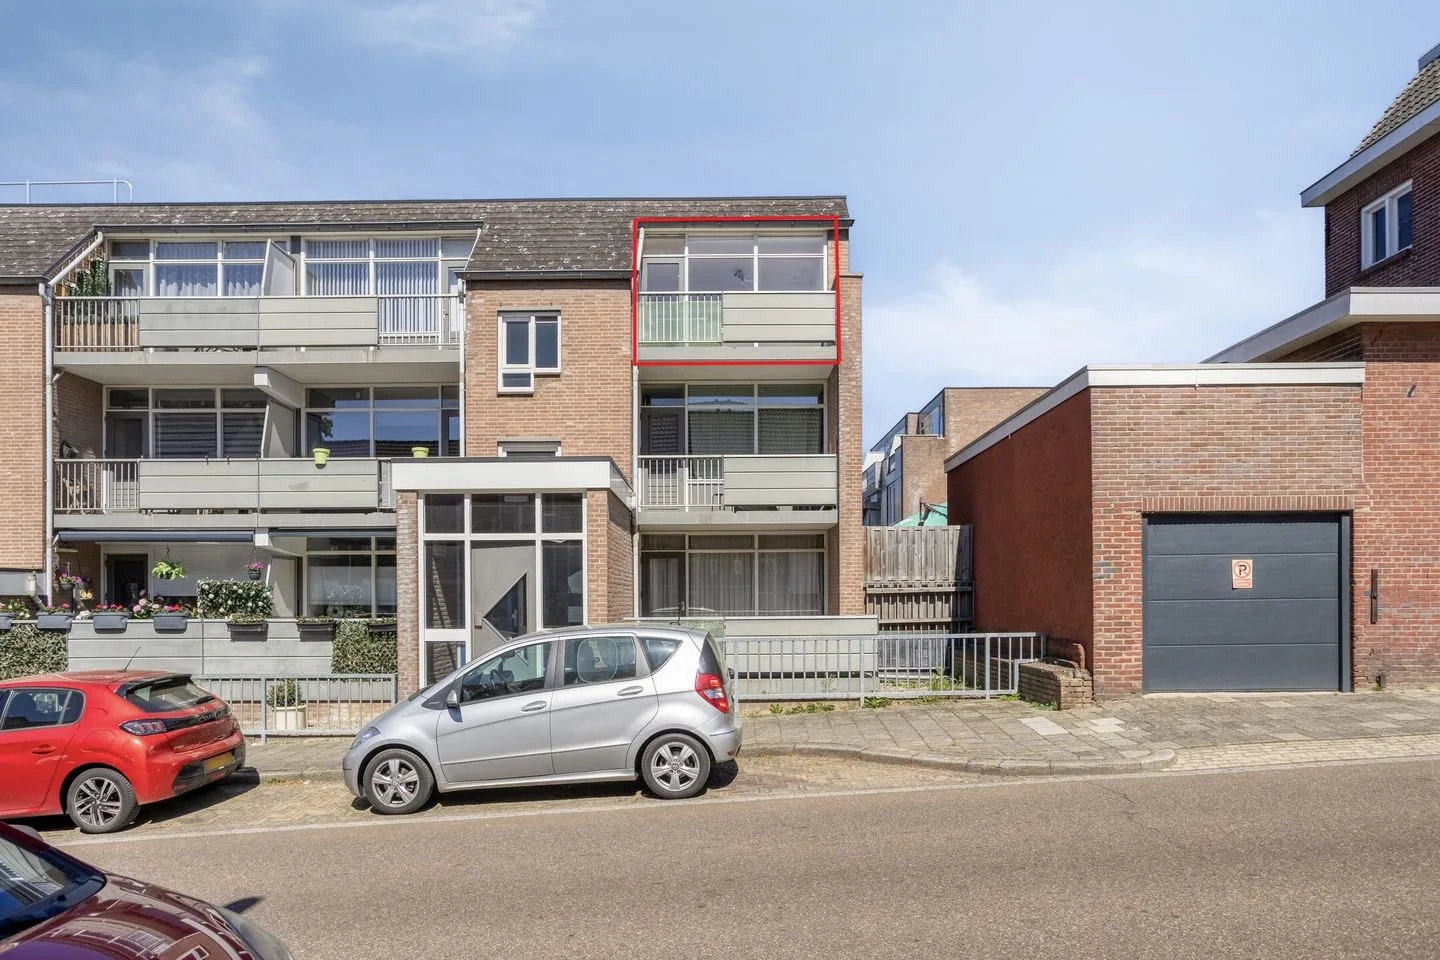
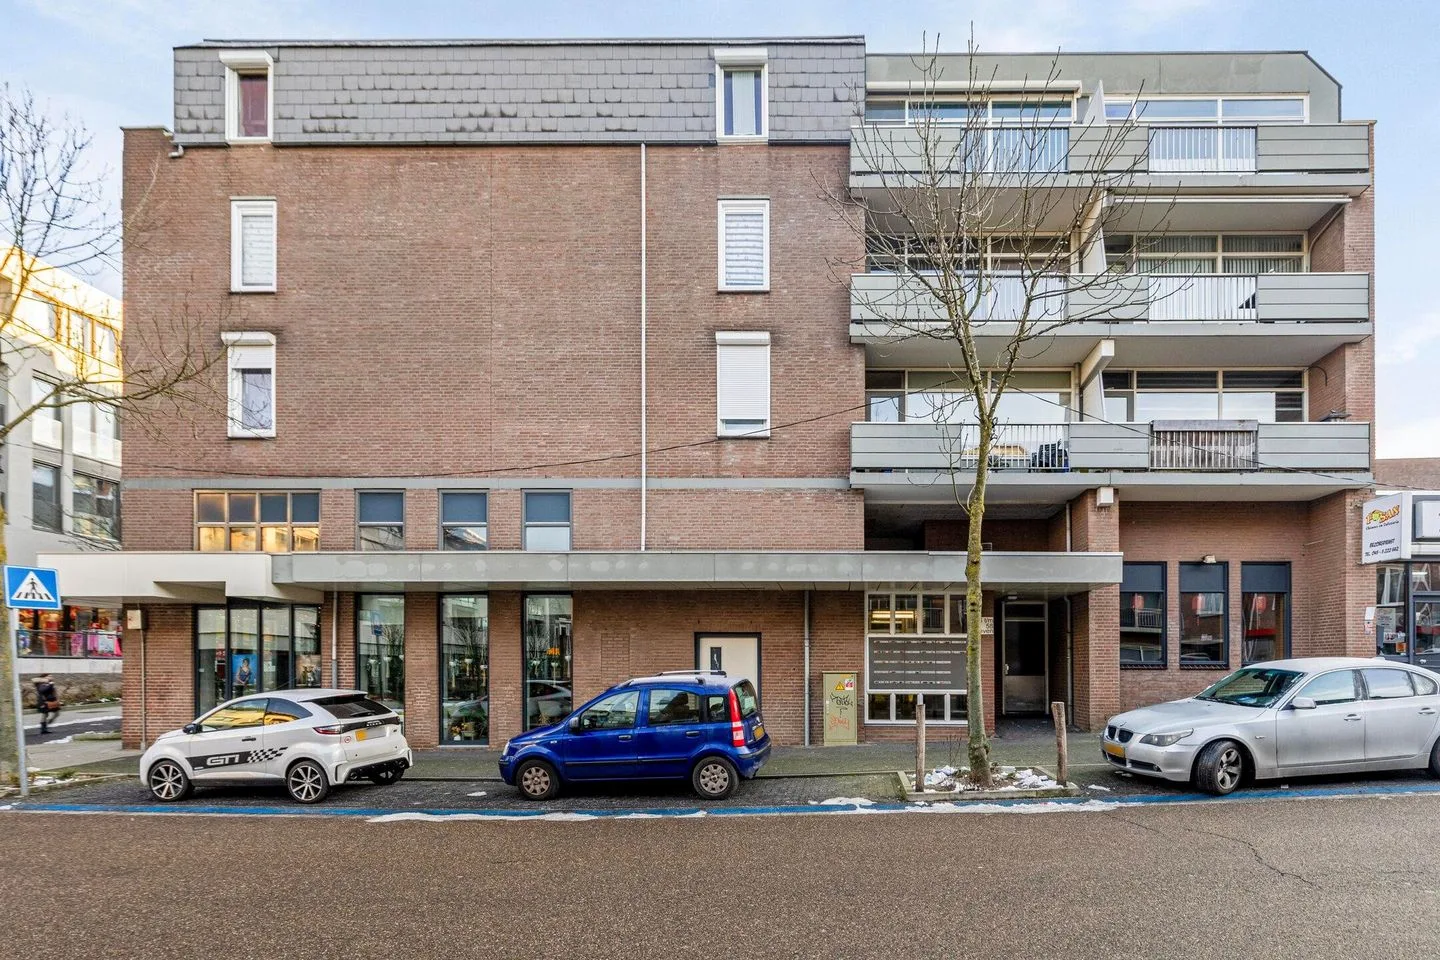
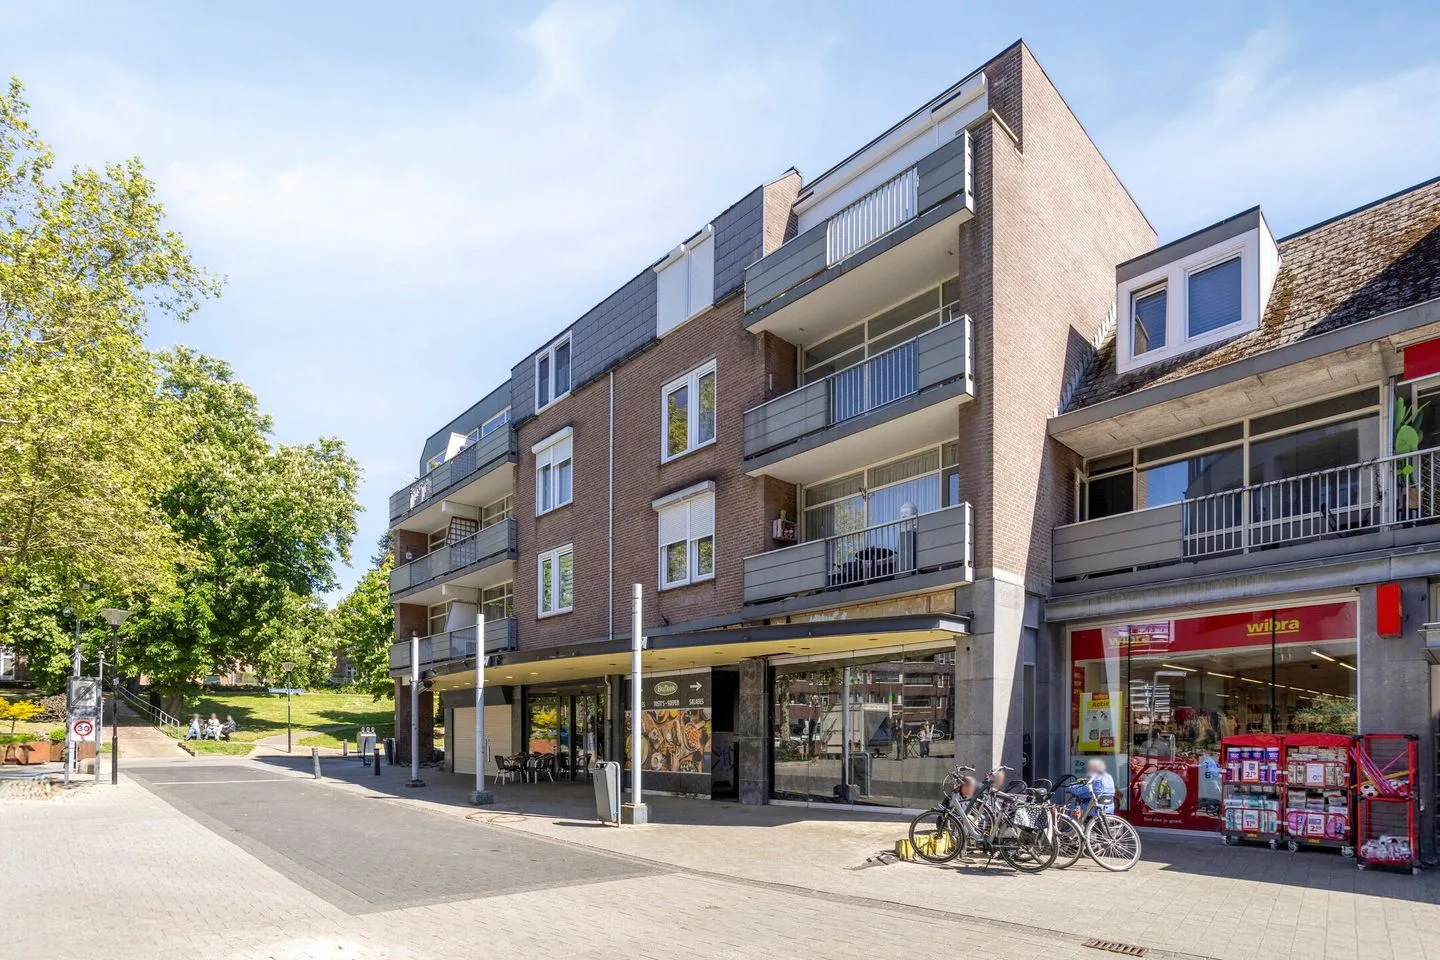
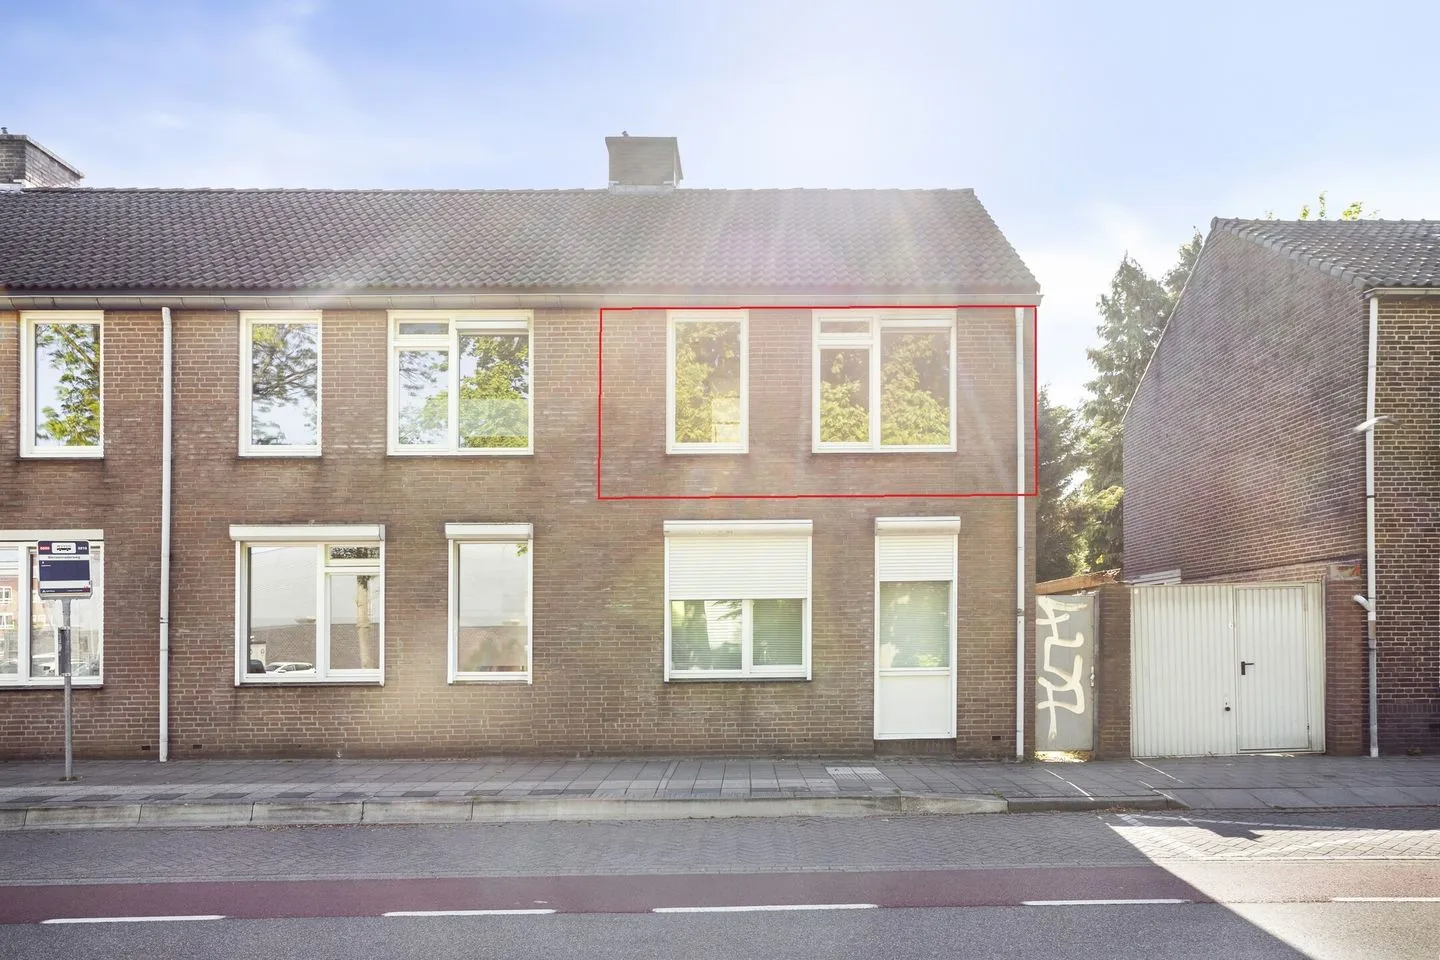
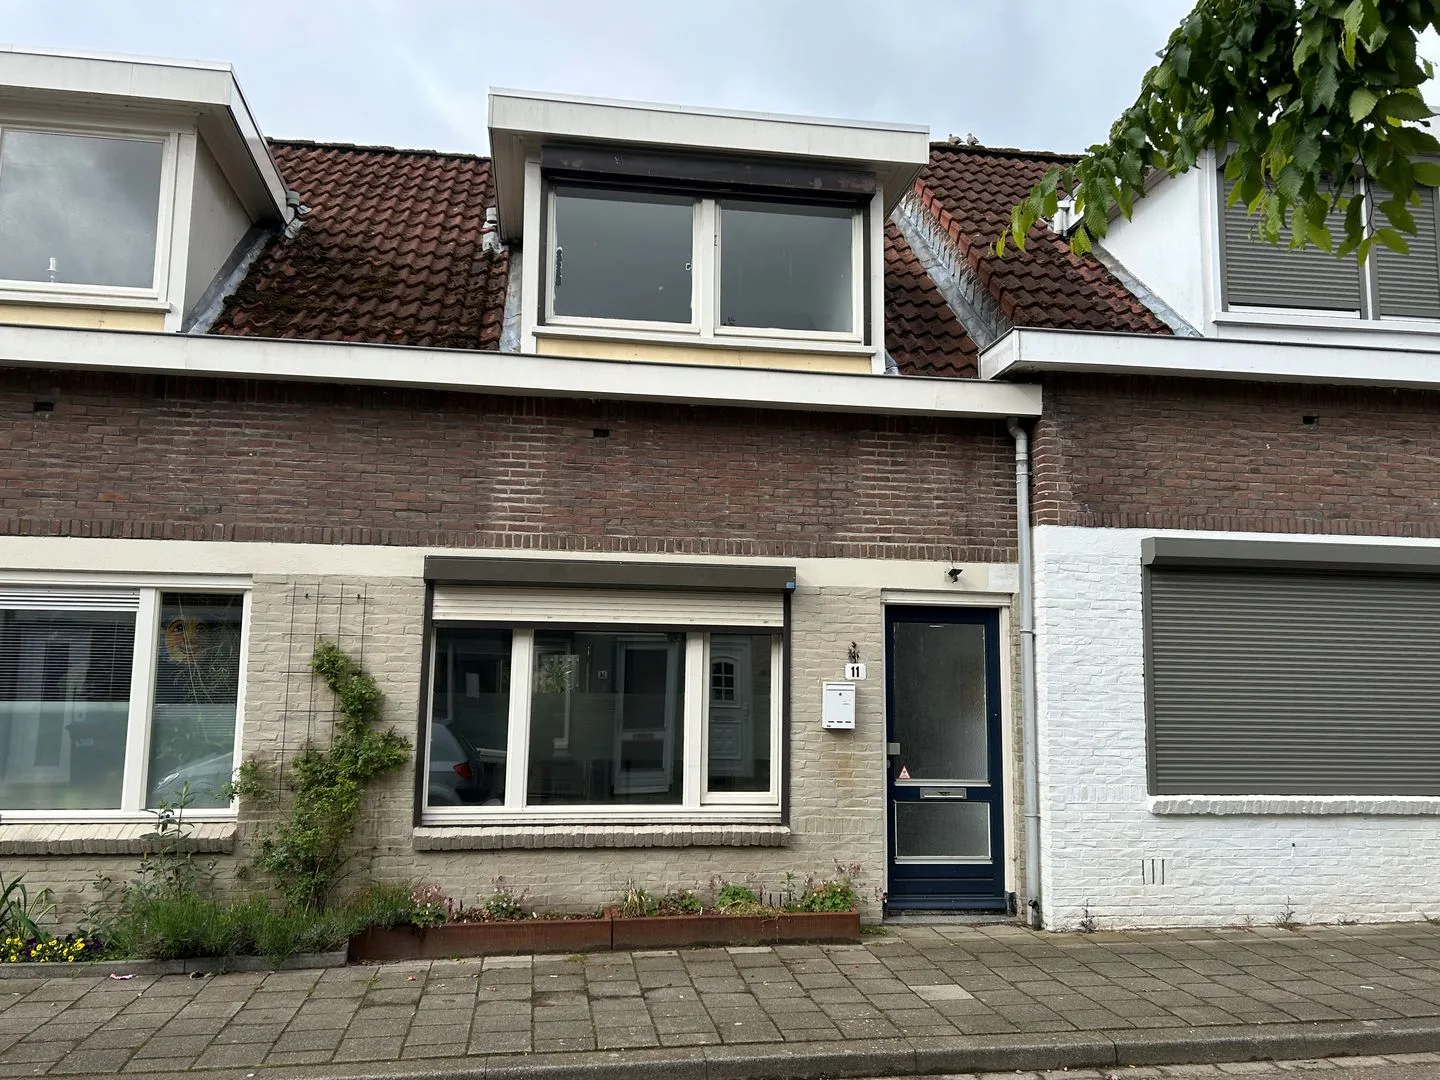
- Available
Benzenraderweg 12
6411ED Heerlen
€ 399.000 k.k.
€ 2.912/m²
- Living area
- 137 m²
- Land area
- 155 m²
- Bedrooms
- 3
Searching in 873 houses in Heerlen
Type to search. Use arrow down and arrow up to navigate through results and press Enter to open.
Hidden search suggestions.
View current properties in Heerlen or search targeted on street, postal code and property characteristics.
View the current housing stock in Heerlen and quickly filter by price, living area, rooms and more. There are currently 873 houses in this place within our selection. View also 556 sold houses in Heerlen for extra insight into the local housing market.
6411ED Heerlen
€ 399.000 k.k.
€ 2.912/m²
6413JV Heerlen
€ 275.000 k.k.
€ 3.716/m²
6411GT Heerlen
€ 260.000 k.k.
€ 2.955/m²
6411AN Heerlen
€ 198.000 k.k.
€ 1.800/m²
6417SV Heerlen
€ 530 p/m
€ 23/m²
6417SV Heerlen
€ 540 p/m
€ 27/m²
6411BS Heerlen
€ 410 p/m
€ 24/m²
6412ZD Heerlen
€ 289.000 k.k.
€ 3.247/m²
6413EM Heerlen
€ 160.000 k.k.
€ 2.500/m²
6418KS Heerlen
€ 469.000 k.k.
€ 4.264/m²
6419SG Heerlen
€ 429.000 k.k.
€ 3.275/m²
6414AT Heerlen
€ 369.000 k.k.
€ 3.548/m²
6411DN Heerlen
€ 185.000 k.k.
€ 2.256/m²
6411CH Heerlen
€ 400.000 k.k.
€ 2.273/m²
6413CN Heerlen
€ 275.000 k.k.
€ 2.926/m²
6412XN Heerlen
€ 219.000 k.k.
€ 2.305/m²
6411MH Heerlen
€ 159.000 k.k.
€ 2.650/m²
6413ET Heerlen
€ 160.000 k.k.
€ 2.667/m²
6413EP Heerlen
€ 160.000 k.k.
€ 2.462/m²
6417SN Heerlen
€ 115.000 k.k.
€ 2.949/m²
6412DV Heerlen
€ 179.000 k.k.
€ 2.754/m²
6411GA Heerlen
€ 360.000 k.k.
€ 2.500/m²
6412PW Heerlen
€ 1.995.000 k.k.
€ 3.674/m²
6411TW Heerlen
€ 170.000 k.k.
€ 2.656/m²
6419BH Heerlen
€ 345.000 k.k.
€ 2.091/m²
6412HJ Heerlen
€ 175.000 k.k.
€ 2.465/m²
6415RH Heerlen
€ 398.000 k.k.
€ 3.134/m²
6413SG Heerlen
€ 17.950 k.k.
Get free quotes from real estate agents with local market knowledge. Compare more than 62 real estate agents in Heerlen.
Selling a home in Heerlen? View the sales-oriented guide sell a house in Heerlen, compare all real estate agents in Heerlen or view the top 10 real estate agents in Heerlen for extra context to your choice.
Real estate agents make sharper offers when they know you're comparing — ask for quotes for sale or purchase.
Practical answers about housing supply, sales and comparing real estate agents in Heerlen.
The costs of a real estate agent in Heerlen depend on commission, setup costs, property presentation and the chosen service. Compare the 62 real estate agents in Heerlen via the real estate agent page and request multiple quotes to compare rates and approach well.
Within our selection, we are currently showing 873 houses in Heerlen. View also the sold houses in Heerlen to compare the current offering with recent transactions.
Take into account not only price and living area but also maintenance, energy label, location, outdoor space and sales status. This way you compare houses in Heerlen on more than just the asking price.
A local real estate agent knows the neighborhoods, recent transactions and demand in Heerlen. By comparing 62 real estate agents in the region you get a better insight into prices, sales strategy and expected yield; the top 10 in Heerlen provides a useful starting point.
Yes, when making a sales plan, a valuation in Heerlen is wise. You gain insight into a realistic asking price and can then compare offers from real estate agents specifically.
View current location data on residents, WOZ development, housing stock, energy consumption, business activity and safety in Heerlen. In 2026 were there 69.029 residents. The average WOZ value in 2025 is EUR 218.029.
These figures help to better assess and compare the housing stock in Heerlen with recent sold homes. Orient yourself then on suitable top real estate agents in Heerlen for sales advice in this region.
Residents
69.029
Last year: 2026
Average WOZ
EUR 218.029
Last year: 2025
Average income per person.
EUR 29.202
Source: AllNumbers
Crimes (current year)
4.829
Total registered
| Year | Residents |
|---|---|
| 2021 | 68.002 |
| 2022 | 67.963 |
| 2023 | 68.283 |
| 2024 | 68.638 |
| 2025 | 68.815 |
| 2026 | 69.029 |
| Year | Average WOZ |
|---|---|
| 2021 | EUR 161.327 |
| 2022 | EUR 173.225 |
| 2023 | EUR 205.872 |
| 2024 | EUR 203.030 |
| 2025 | EUR 218.029 |
Hoger
12.893
Praktisch
16.908
Middelbaar
21.848
Europa
11.090
Nederland
45.575
Buiten Europa
12.160
Label C
10.659
Label A
5.993
Label B
5.625
Label D
4.213
Label E
3.598
Label F
3.468
Label G
3.286
Label A+
727
Label A++
255
Label A+++
178
Label A++++
55
Label A+++++
9
| Year | Gas (m3) | Electricity (kWh) |
|---|---|---|
| 2020 | 1.080 | 2.557 |
| 2021 | 1.218 | 2.591 |
| 2022 | 957 | 2.476 |
| 2023 | 810 | 2.376 |
| 2024 | 782 | 2.391 |
Hoekwoning
Gas: 1.013 • Electricity: 2.728
Huurwoning
Gas: 708 • Electricity: 2.003
Koopwoning
Gas: 908 • Electricity: 2.784
Appartement
Gas: 591 • Electricity: 1.777
Tussenwoning
Gas: 888 • Electricity: 2.552
Vrijstaande woning
Gas: 1.472 • Electricity: 3.817
Twee-onder-één-kap woning
Gas: 1.124 • Electricity: 2.986
Total number of company establishments: 7.095
| Period | Crimes |
|---|---|
| jan 2026 | 341 |
| jul 2025 | 411 |
| jun 2025 | 429 |
| mei 2025 | 382 |
| mrt 2025 | 411 |
| mrt 2026 | 432 |
| nov 2024 | 419 |
| nov 2025 | 455 |
| okt 2024 | 452 |
| okt 2025 | 434 |
| sep 2024 | 422 |
| sep 2025 | 389 |
These figures give an indicative picture of safety trends in the living environment of Heerlen.
Short answers based on current local statistics, handy for a quick comparison of the living environment.
Heerlen telt in 2026 ongeveer 69.029 inwoners.
De gemiddelde WOZ-waarde in Heerlen is in 2025 circa € 218.029.
Het gemiddelde inkomen per inwoner in Heerlen ligt rond € 29.202 per jaar.
Voor het huidige jaar gaat het om ongeveer 4.829 geregistreerde misdrijven. Gebruik deze cijfers als indicatie en vergelijk trends per periode.
In Heerlen komt vooral "Appartementen" veel voor, met ongeveer 15.001 woningen.