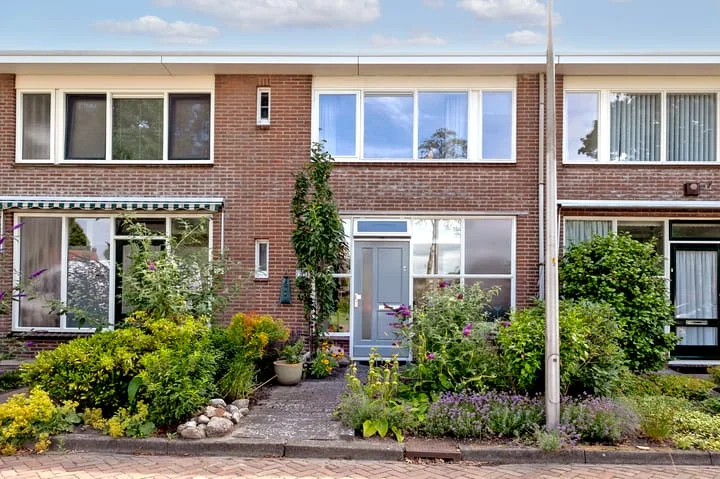
Woningaanbod in Hoogeveen

Found: 536 houses in Hoogeveen within your selection

Connected to: Vastgoed Nederland NVM Makelaars

Bekijk het actuele woningaanbod in Hoogeveen en filter snel op prijs, woonoppervlakte, kamers en meer. Er staan momenteel 536 houses in deze plaats binnen onze selectie. View also 417 sold houses in Hoogeveen for extra insight into the local housing market.

Selection

Search and filter homes

Set your preferences and discover homes that suit you.

Total supply 240.002
Filters

Set price, area and other characteristics. Adjust a filter or click on Show homes. Location changes directly above.

Reset filters

You search for

  • Place Hoogeveen

Selling a home in Hoogeveen? Compare realtor offers

Get free quotes from realtors with local market knowledge in Hoogeveen.

Free request a quote

  • Quotes in Hoogeveen
  • Non-binding
  • Personal
  • Free property website

Selling a home in Hoogeveen? Compare real estate agents who know the local housing market. Also check out all real estate agents in Hoogeveen or the top 10 real estate agents in Hoogeveen for extra context for your choice.

Save an average of €5000,-

By comparing brokers and requesting quotes

Veelgestelde vragen over woningen in Hoogeveen

Praktische antwoorden over woningaanbod, verkoop en makelaars vergelijken in Hoogeveen.

Residential and neighborhood statistics in Hoogeveen

View current location data on residents, WOZ development, housing stock, energy consumption, business activity and safety in Hoogeveen. In 2025 were there 40.900 residents. The average WOZ value in 2025 is EUR 263.066.

These figures help to better assess and compare the housing stock in Hoogeveen with recent sold homes. Orient yourself then on suitable top real estate agents in Hoogeveen for sales advice in this region.

Residents

40.900

Last year: 2025

Average WOZ

EUR 263.066

Last year: 2025

Average income per person.

EUR 28.622

Source: AllNumbers

Crimes (current year)

1.851

Total registered

Demographics and WOZ development

Inhabitants per year

Inhabitants per year in Hoogeveen
Year Residents
2021 39.905
2022 40.135
2023 40.560
2024 40.675
2025 40.900

Annual WOZ value

WOZ value per year in Hoogeveen
Year Average WOZ
2021 EUR 187.109
2022 EUR 203.749
2023 EUR 235.977
2024 EUR 249.737
2025 EUR 263.066

Composition of residents

Age build-up

65+: 9.655 0-15: 5.960 15-25: 4.995 25-45: 9.935 45-65: 10.355

Education level

Hoger

5.880

Praktisch

10.130

Middelbaar

13.980

Origin of residents (2025)

Europa

2.410

Nederland

33.130

Buiten Europa

5.360

Housing stock and construction periods

Types of homes

Hoekwoningen 3.086
Appartementen 6.183
Tussenwoningen 6.414
Vrijstaande woningen 1.789
Twee-onder-één-kap woningen 2.047

Construction period of buildings

Voor 1700 5
1700 tot 1900 38
1900 tot 1925 233
1925 tot 1950 1.146
1950 tot 1970 4.546
1970 tot 1980 3.471
1980 tot 1990 2.222
1990 tot 2000 1.654
2000 tot 2010 1.654
2010 tot 2020 681
2020 en later 438

Energy and sustainability

Energy label distribution

Label A

6.089

Label C

5.666

Label B

3.160

Label D

1.903

Label E

1.044

Label G

837

Label F

735

Label A+

300

Label A+++

204

Label A++

125

Label A++++

76

Label A+++++

10

Average energy consumption per year

Average energy consumption per year in Hoogeveen
Year Gas (m3) Electricity (kWh)
2020 1.189 2.506
2021 1.326 2.541
2022 1.050 2.419
2023 882 2.333
2024 849 2.399

Consumption per house type

Hoekwoning

Gas: 985 • Electricity: 2.505

Huurwoning

Gas: 741 • Electricity: 1.858

Koopwoning

Gas: 999 • Electricity: 2.670

Appartement

Gas: 623 • Electricity: 1.678

Tussenwoning

Gas: 873 • Electricity: 2.315

Vrijstaande woning

Gas: 1.413 • Electricity: 3.527

Twee-onder-één-kap woning

Gas: 1.082 • Electricity: 2.769

Business activity in Hoogeveen (2025)

Handel en HORECA 1.080
Nijverheid en energie 670
Zakelijke dienstverlening 810
Overheid, onderwijs en zorg 690
Landbouw, bosbouw en visserij 30
Vervoer, informatie en communicatie 245
Financiele diensten en onroerendgoed 235
Cultuur, recreatie en overige diensten 395

Total number of company establishments: 4.140

Recent crime statistics

Recent crime statistics in Hoogeveen
Period Crimes
jan 2025 179
jan 2026 189
jul 2025 158
jun 2025 155
mei 2025 134
mrt 2025 162
nov 2024 119
nov 2025 171
okt 2024 204
okt 2025 154
sep 2024 160
sep 2025 141

These figures give an indicative picture of safety trends in the living environment of Hoogeveen.

Frequently asked questions about living in Hoogeveen

Short answers based on current local statistics, handy for a quick comparison of the living environment.

Hoeveel inwoners heeft Hoogeveen?

Hoogeveen telt in 2025 ongeveer 40.900 inwoners.

Wat is de gemiddelde WOZ-waarde in Hoogeveen?

De gemiddelde WOZ-waarde in Hoogeveen is in 2025 circa € 263.066.

Wat is het gemiddelde inkomen per inwoner in Hoogeveen?

Het gemiddelde inkomen per inwoner in Hoogeveen ligt rond € 28.622 per jaar.

Hoe veilig is wonen in Hoogeveen?

Voor het huidige jaar gaat het om ongeveer 1.851 geregistreerde misdrijven. Gebruik deze cijfers als indicatie en vergelijk trends per periode.

Welke woningtypen komen het meest voor in Hoogeveen?

In Hoogeveen komt vooral "Tussenwoningen" veel voor, met ongeveer 6.414 woningen.