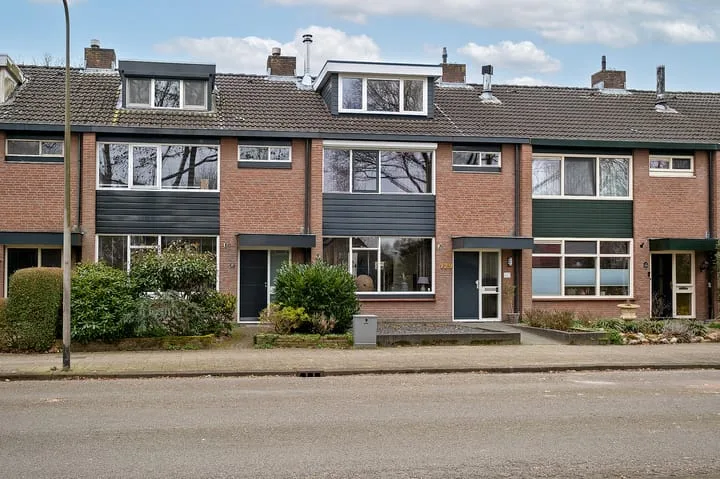
- Sold
Pesserstraat 36
7901LC Hoogeveen
€ 310.000 k.k.
€ 3.875/m²
- Living area
- 80 m²
- Land area
- 132 m²
- Bedrooms
- 3
View 417 sold houses in Hoogeveen
Type to search. Use arrow down and arrow up to navigate through results and press Enter to open.
Hidden search suggestions.
Compare sold homes in Hoogeveen or view the current offering in this location directly.
On this page you will find recently sold homes in Hoogeveen. Use this overview to better estimate selling prices, popular neighborhoods, and the local housing supply before you choose a real estate agent. Also view the current housing supply with 536 houses in Hoogeveen.
7901LC Hoogeveen
€ 310.000 k.k.
€ 3.875/m²
7901LE Hoogeveen
€ 315.000 k.k.
€ 3.938/m²
7906DE Hoogeveen
€ 409.500 k.k.
€ 4.875/m²
7908WZ Hoogeveen
€ 529.000 k.k.
€ 3.245/m²
7904AH Hoogeveen
€ 294.500 k.k.
€ 3.067/m²
7901LE Hoogeveen
€ 275.000 k.k.
€ 3.571/m²
7906EJ Hoogeveen
€ 215.000 k.k.
€ 2.986/m²
7908AZ Hoogeveen
€ 389.500 k.k.
€ 3.477/m²
7901HP Hoogeveen
€ 325.000 k.k.
€ 3.250/m²
7906BH Hoogeveen
€ 275.000 k.k.
€ 2.956/m²
7905CT Hoogeveen
€ 415.000 k.k.
€ 3.458/m²
7908BH Hoogeveen
€ 335.000 k.k.
€ 2.680/m²
7906KB Hoogeveen
€ 189.000 k.k.
€ 2.589/m²
7904LN Hoogeveen
€ 325.000 k.k.
€ 4.276/m²
7906JA Hoogeveen
€ 325.000 k.k.
€ 2.600/m²
7904CC Hoogeveen
€ 425.000 k.k.
€ 2.931/m²
7908EN Hoogeveen
€ 310.000 k.k.
€ 3.100/m²
7905EB Hoogeveen
€ 359.500 k.k.
€ 2.830/m²
7908MV Hoogeveen
€ 425.000 k.k.
€ 3.427/m²
7905GM Hoogeveen
€ 237.500 k.k.
€ 3.893/m²
7905ED Hoogeveen
€ 375.000 k.k.
€ 2.737/m²
7909HJ Hoogeveen
€ 599.500 k.k.
€ 4.134/m²
7905HS Hoogeveen
€ 229.500 k.k.
€ 2.700/m²
7902CE Hoogeveen
€ 275.000 k.k.
€ 2.669/m²
7906KK Hoogeveen
€ 225.000 k.k.
€ 3.082/m²
7901JC Hoogeveen
€ 125.000 k.k.
€ 4.032/m²
7901AA Hoogeveen
€ 385.000 k.k.
€ 4.010/m²
7901BG Hoogeveen
€ 450.000 k.k.
€ 3.461/m²
Get free quotes from realtors with local market knowledge in Hoogeveen.
Selling a home in Hoogeveen? Compare real estate agents who know the local housing market. Also check out all real estate agents in Hoogeveen or the top 10 real estate agents in Hoogeveen for extra context for your choice.
By comparing brokers and requesting quotes
Short answers about housing prices, sold homes and comparing real estate agents in Hoogeveen.
The costs of a real estate agent in Hoogeveen vary per office, property type and sales approach. Therefore, compare multiple quotes and also look at the real estate agents in Hoogeveen to better compare rates, presentation and local experience.
On this page we currently show 417 sold houses in Hoogeveen from our selection. This helps you to better assess recent transactions and the local housing market.
Verkochte woningen in Hoogeveen geven inzicht in vraagprijzen, woningtypes en buurten waar recent transacties hebben plaatsgevonden. Vergelijk dit ook met het actuele woningaanbod in Hoogeveen om de markt beter te duiden.
Je kunt verkochte woningen gebruiken als eerste marktindicatie, maar een lokale makelaar kan beter rekening houden met afwerking, ligging, onderhoud en actuele vraag in Hoogeveen.
Vergelijk makelaars in Hoogeveen op lokale verkoopervaring, reviews, verwachte opbrengst, courtage en marketingaanpak. De top 10 makelaars in Hoogeveen helpt om snel sterke kantoren te ontdekken.
View current location data on residents, WOZ development, housing stock, energy consumption, business activity and safety in Hoogeveen. In 2025 were there 40.900 residents. The average WOZ value in 2025 is EUR 263.066.
These figures help to better assess and compare the housing stock in Hoogeveen with recent sold homes. Orient yourself then on suitable top real estate agents in Hoogeveen for sales advice in this region.
Residents
40.900
Last year: 2025
Average WOZ
EUR 263.066
Last year: 2025
Average income per person.
EUR 28.622
Source: AllNumbers
Crimes (current year)
1.851
Total registered
| Year | Residents |
|---|---|
| 2021 | 39.905 |
| 2022 | 40.135 |
| 2023 | 40.560 |
| 2024 | 40.675 |
| 2025 | 40.900 |
| Year | Average WOZ |
|---|---|
| 2021 | EUR 187.109 |
| 2022 | EUR 203.749 |
| 2023 | EUR 235.977 |
| 2024 | EUR 249.737 |
| 2025 | EUR 263.066 |
Hoger
5.880
Praktisch
10.130
Middelbaar
13.980
Europa
2.410
Nederland
33.130
Buiten Europa
5.360
Label A
6.089
Label C
5.666
Label B
3.160
Label D
1.903
Label E
1.044
Label G
837
Label F
735
Label A+
300
Label A+++
204
Label A++
125
Label A++++
76
Label A+++++
10
| Year | Gas (m3) | Electricity (kWh) |
|---|---|---|
| 2020 | 1.189 | 2.506 |
| 2021 | 1.326 | 2.541 |
| 2022 | 1.050 | 2.419 |
| 2023 | 882 | 2.333 |
| 2024 | 849 | 2.399 |
Hoekwoning
Gas: 985 • Electricity: 2.505
Huurwoning
Gas: 741 • Electricity: 1.858
Koopwoning
Gas: 999 • Electricity: 2.670
Appartement
Gas: 623 • Electricity: 1.678
Tussenwoning
Gas: 873 • Electricity: 2.315
Vrijstaande woning
Gas: 1.413 • Electricity: 3.527
Twee-onder-één-kap woning
Gas: 1.082 • Electricity: 2.769
Total number of company establishments: 4.140
| Period | Crimes |
|---|---|
| jan 2025 | 179 |
| jan 2026 | 189 |
| jul 2025 | 158 |
| jun 2025 | 155 |
| mei 2025 | 134 |
| mrt 2025 | 162 |
| nov 2024 | 119 |
| nov 2025 | 171 |
| okt 2024 | 204 |
| okt 2025 | 154 |
| sep 2024 | 160 |
| sep 2025 | 141 |
These figures give an indicative picture of safety trends in the living environment of Hoogeveen.
Short answers based on current local statistics, handy for a quick comparison of the living environment.
Hoogeveen telt in 2025 ongeveer 40.900 inwoners.
De gemiddelde WOZ-waarde in Hoogeveen is in 2025 circa € 263.066.
Het gemiddelde inkomen per inwoner in Hoogeveen ligt rond € 28.622 per jaar.
Voor het huidige jaar gaat het om ongeveer 1.851 geregistreerde misdrijven. Gebruik deze cijfers als indicatie en vergelijk trends per periode.
In Hoogeveen komt vooral "Tussenwoningen" veel voor, met ongeveer 6.414 woningen.