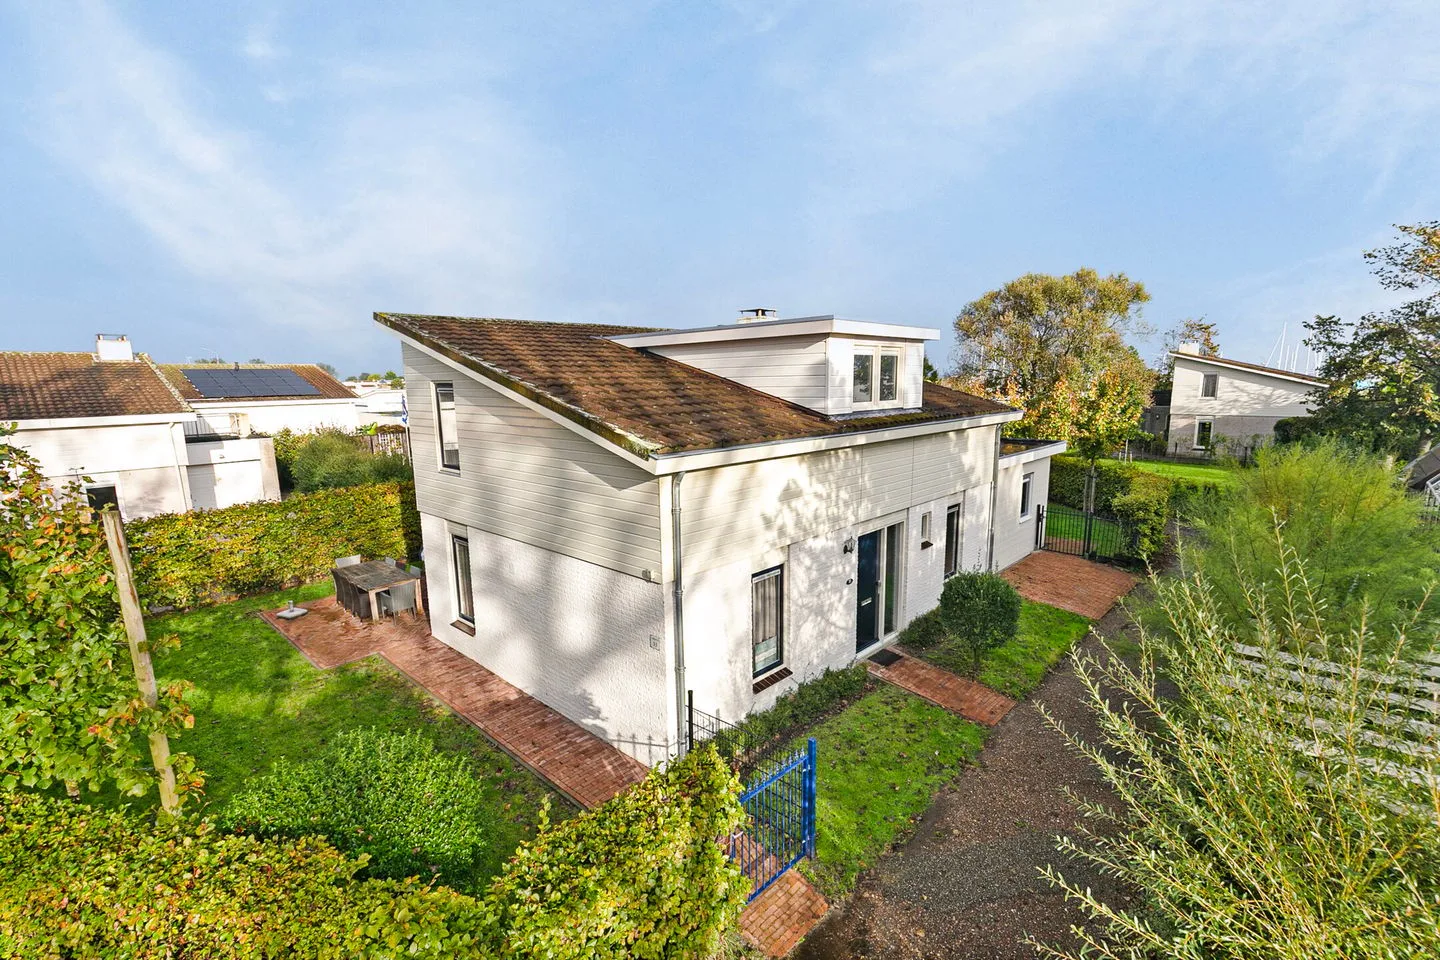
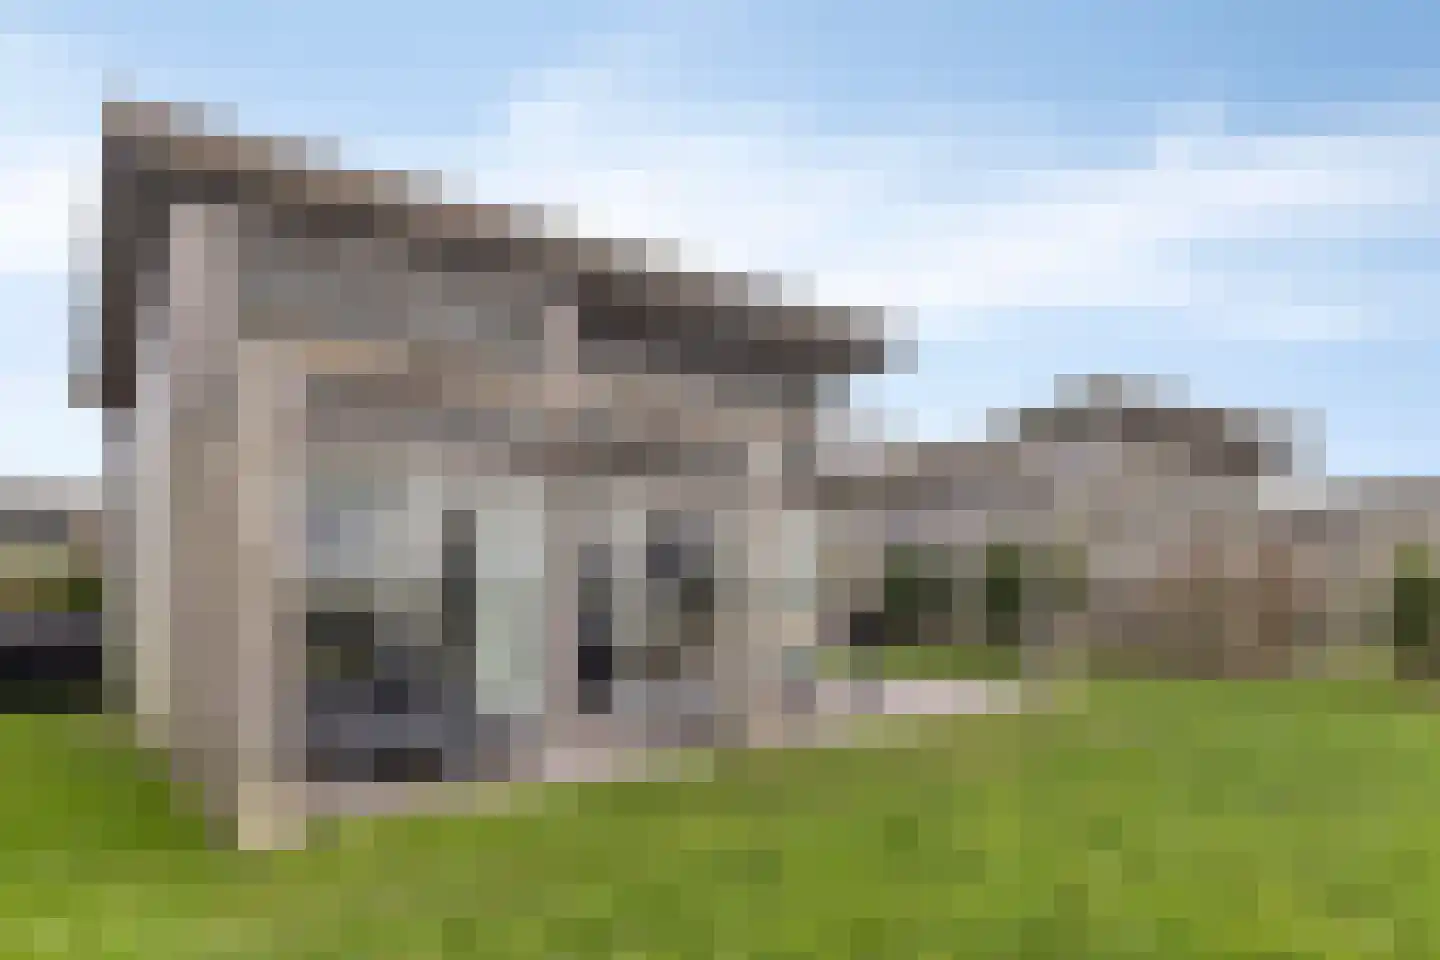
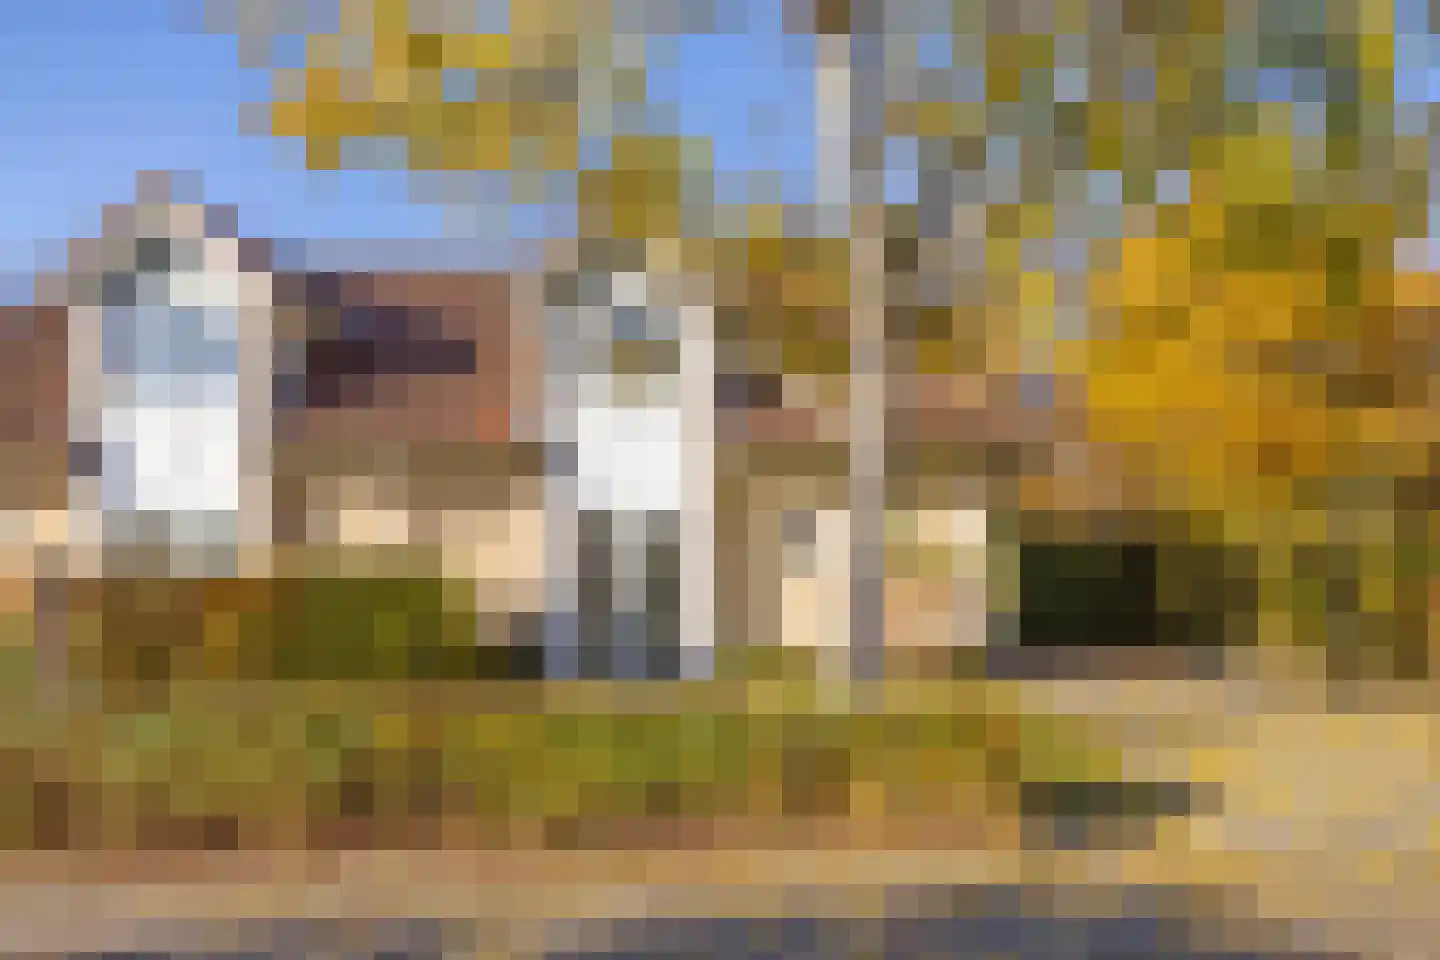
- Available
Helmgras 39
4493RM Kamperland
€ 449.000 k.k.
- Living area
- 118 m²
- Land area
- 380 m²
- Bedrooms
- 4
Searching in 117 houses in Kamperland
Type to search. Use arrow down and arrow up to navigate through results and press Enter to open.
Hidden search suggestions.
View current properties in Kamperland or search targeted on street, postal code and property characteristics.
View the current housing stock in Kamperland and quickly filter by price, living area, rooms and more. There are currently 117 houses in this place within our selection. View also 17 sold houses in Kamperland for extra insight into the local housing market.
4493RM Kamperland
€ 449.000 k.k.
4493CX Kamperland
€ 45.000 k.k.
4493PK Kamperland
€ 499.000 k.k.
4493PK Kamperland
€ 529.000 k.k.
4493CT Kamperland
€ 575.000 k.k.
€ 3.528/m²
4493AJ Kamperland
€ 319.000 k.k.
€ 3.038/m²
4493PP Kamperland
€ 759.000 k.k.
€ 4.193/m²
4493CJ Kamperland
€ 1.469.000 k.k.
€ 8.161/m²
4493CX Kamperland
€ 36.500 k.k.
€ 822/m²
4493CX Kamperland
€ 64.500 k.k.
€ 1.791/m²
4493SW Kamperland
€ 365.000 k.k.
€ 4.345/m²
4493DK Kamperland
€ 589.000 k.k.
€ 6.072/m²
4493BP Kamperland
€ 437.500 k.k.
€ 3.838/m²
4493NL Kamperland
€ 375.000 k.k.
€ 5.952/m²
4493ST Kamperland
€ 295.000 k.k.
€ 8.676/m²
4493AH Kamperland
€ 650.000 k.k.
€ 4.514/m²
4493MA Kamperland
€ 825.000 k.k.
€ 6.389/m²
4493PL Kamperland
€ 590.000 k.k.
€ 7.866/m²
4493CL Kamperland
€ 469.000 k.k.
€ 5.154/m²
4493NA Kamperland
€ 474.500 k.k.
€ 4.314/m²
4493AK Kamperland
€ 374.500 k.k.
€ 3.405/m²
4493DL Kamperland
€ 999.000 k.k.
€ 4.078/m²
4493PJ Kamperland
€ 799.000 k.k.
€ 6.291/m²
4493EH Kamperland
€ 625.000 k.k.
€ 3.289/m²
4493SV Kamperland
€ 449.000 k.k.
€ 4.776/m²
4493RV Kamperland
€ 475.000 k.k.
€ 4.025/m²
4493CX Kamperland
€ 69.500 k.k.
€ 1.447/m²
4493RM Kamperland
€ 389.000 k.k.
€ 4.924/m²
Get free quotes from real estate agents with local market knowledge. Compare more than 15 real estate agents in Kamperland.
Selling a home in Kamperland? View the sales-oriented guide sell a house in Kamperland, compare all real estate agents in Kamperland or view the top 10 real estate agents in Kamperland for extra context to your choice.
Real estate agents make sharper offers when they know you're comparing — ask for quotes for sale or purchase.
Practical answers about housing supply, sales and comparing real estate agents in Kamperland.
The costs of a real estate agent in Kamperland depend on commission, setup costs, property presentation and the chosen service. Compare the 15 real estate agents in Kamperland via the real estate agent page and request multiple quotes to compare rates and approach well.
Within our selection, we are currently showing 117 houses in Kamperland. View also the sold houses in Kamperland to compare the current offering with recent transactions.
Take into account not only price and living area but also maintenance, energy label, location, outdoor space and sales status. This way you compare houses in Kamperland on more than just the asking price.
A local real estate agent knows the neighborhoods, recent transactions and demand in Kamperland. By comparing 15 real estate agents in the region you get a better insight into prices, sales strategy and expected yield; the top 10 in Kamperland provides a useful starting point.
Yes, when making a sales plan, a valuation in Kamperland is wise. You gain insight into a realistic asking price and can then compare offers from real estate agents specifically.
View current location data on residents, WOZ development, housing stock, energy consumption, business activity and safety in Kamperland. In 2025 were there 2.230 residents. The average WOZ value in 2025 is EUR 411.000.
These figures help to better assess and compare the housing stock in Kamperland with recent sold homes. Orient yourself then on suitable top real estate agents in Kamperland for sales advice in this region.
Residents
2.230
Last year: 2025
Average WOZ
EUR 411.000
Last year: 2025
Average income per person.
EUR 33.200
Source: AllNumbers
Crimes (current year)
90
Total registered
| Year | Residents |
|---|---|
| 2021 | 2.100 |
| 2022 | 2.085 |
| 2023 | 2.180 |
| 2024 | 2.195 |
| 2025 | 2.230 |
| Year | Average WOZ |
|---|---|
| 2021 | EUR 305.000 |
| 2022 | EUR 335.000 |
| 2023 | EUR 382.000 |
| 2024 | EUR 389.000 |
| 2025 | EUR 411.000 |
Hoger
430
Praktisch
350
Middelbaar
840
Europa
240
Nederland
1.870
Buiten Europa
115
Label C
851
Label B
631
Label A
620
Label G
277
Label D
202
Label F
113
Label A+
86
Label E
60
Label A+++
53
Label A++
23
Label A++++
20
Label A+++++
1
| Year | Gas (m3) | Electricity (kWh) |
|---|---|---|
| 2020 | 1.180 | 2.430 |
| 2021 | 1.350 | 2.650 |
| 2022 | 1.040 | 2.520 |
| 2023 | 860 | 2.460 |
| 2024 | 850 | 2.570 |
Hoekwoning
Gas: 720 • Electricity: 1.940
Huurwoning
Gas: 750 • Electricity: 2.030
Koopwoning
Gas: 910 • Electricity: 2.640
Appartement
Gas: 590 • Electricity: 2.050
Tussenwoning
Gas: 660 • Electricity: 1.890
Vrijstaande woning
Gas: 980 • Electricity: 2.790
Twee-onder-één-kap woning
Gas: 870 • Electricity: 2.420
Total number of company establishments: 430
| Period | Crimes |
|---|---|
| jan 2026 | 4 |
| jul 2025 | 11 |
| jun 2025 | 10 |
| mei 2025 | 7 |
| mrt 2025 | 5 |
| mrt 2026 | 2 |
| nov 2024 | 6 |
| nov 2025 | 5 |
| okt 2024 | 4 |
| okt 2025 | 4 |
| sep 2024 | 6 |
| sep 2025 | 9 |
These figures give an indicative picture of safety trends in the living environment of Kamperland.
Short answers based on current local statistics, handy for a quick comparison of the living environment.
Kamperland telt in 2025 ongeveer 2.230 inwoners.
De gemiddelde WOZ-waarde in Kamperland is in 2025 circa € 411.000.
Het gemiddelde inkomen per inwoner in Kamperland ligt rond € 33.200 per jaar.
Voor het huidige jaar gaat het om ongeveer 90 geregistreerde misdrijven. Gebruik deze cijfers als indicatie en vergelijk trends per periode.
In Kamperland komt vooral "Vrijstaande woningen" veel voor, met ongeveer 793 woningen.