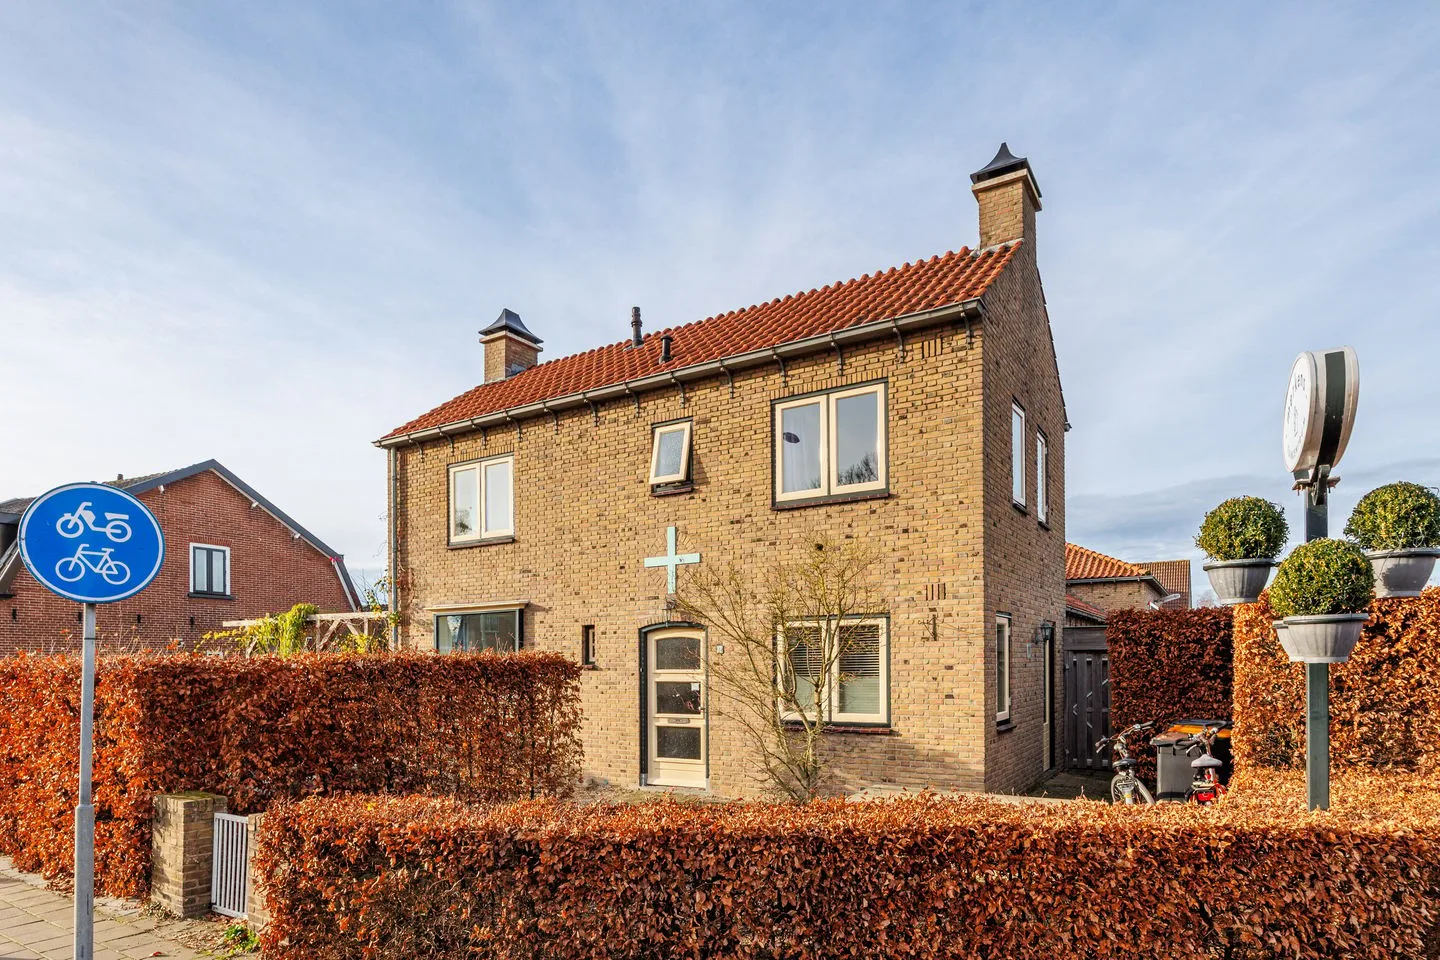
- Sold
Doornseweg 32
3947ME Langbroek
€ 350.000 k.k.
€ 4.321/m²
- Living area
- 81 m²
- Land area
- 130 m²
- Bedrooms
- 2
View 12 sold houses in Langbroek
Type to search. Use arrow down and arrow up to navigate through results and press Enter to open.
Hidden search suggestions.
Compare sold homes in Langbroek or view the current offering in this location directly.
On this page you will find recently sold homes in Langbroek. Use this overview to better estimate selling prices, popular neighborhoods, and the local housing supply before you choose a real estate agent. Also view the current housing supply with 18 houses in Langbroek.
3947ME Langbroek
€ 350.000 k.k.
€ 4.321/m²
3947MG Langbroek
€ 395.000 k.k.
€ 5.337/m²
3947BE Langbroek
€ 850.000 k.k.
€ 6.071/m²
3947ME Langbroek
€ 425.000 k.k.
€ 4.292/m²
3947ME Langbroek
€ 495.000 k.k.
€ 4.380/m²
3947MR Langbroek
€ 475.000 k.k.
€ 5.000/m²
3947PE Langbroek
€ 595.000 k.k.
€ 4.648/m²
3947MN Langbroek
€ 565.000 k.k.
€ 5.183/m²
3947BB Langbroek
€ 1.635.000 k.k.
€ 6.055/m²
3947NT Langbroek
€ 425.000 k.k.
€ 3.512/m²
3947PB Langbroek
€ 498.000 k.k.
€ 3.582/m²
3947ME Langbroek
€ 480.000 k.k.
€ 4.363/m²
Bekijk recente verkopen en ontvang gratis offertes van lokale verkoopmakelaars in Langbroek.
Zelf je woning verkopen in Langbroek? Vergelijk verkoopmakelaars in Langbroek of bekijk de beste verkoopmakelaars in Langbroek als referentie bij jouw keuze.
Makelaars maken scherpere voorstellen als ze weten dat je vergelijkt — vraag offertes aan voor verkoop of aankoop.
Short answers about housing prices, sold homes and comparing real estate agents in Langbroek.
The costs of a real estate agent in Langbroek vary per office, property type and sales approach. Therefore, compare multiple quotes and also look at the real estate agents in Langbroek to better compare rates, presentation and local experience.
On this page we currently show 12 sold houses in Langbroek from our selection. This helps you to better assess recent transactions and the local housing market.
Houses sold in Langbroek give insight into asking prices, house types and neighborhoods where recent transactions have taken place. Compare this also with the current housing stock in Langbroek to better understand the market.
You can use sold homes as a first market indication, but a local real estate agent can better take into account finishing, location, maintenance and current demand in Langbroek.
Vergelijk makelaars in Langbroek op lokale verkoopervaring, reviews, verwachte opbrengst, courtage en marketingaanpak. Bekijk verkoopmakelaars in Langbroek of de top 10 makelaars in Langbroek om snel sterke kantoren te ontdekken.
View current location data on residents, WOZ development, housing stock, energy consumption, business activity and safety in Langbroek. In 2025 were there 2.500 residents. The average WOZ value in 2025 is EUR 560.000.
These figures help to better assess and compare the housing stock in Langbroek with recent sold homes. Orient yourself then on suitable top real estate agents in Langbroek for sales advice in this region.
Residents
2.500
Last year: 2025
Average WOZ
EUR 560.000
Last year: 2025
Average income per person.
EUR 36.000
Source: AllNumbers
Crimes (current year)
27
Total registered
| Year | Residents |
|---|---|
| 2021 | 2.430 |
| 2022 | 2.465 |
| 2023 | 2.510 |
| 2024 | 2.525 |
| 2025 | 2.500 |
| Year | Average WOZ |
|---|---|
| 2021 | EUR 400.000 |
| 2022 | EUR 439.000 |
| 2023 | EUR 507.000 |
| 2024 | EUR 528.000 |
| 2025 | EUR 560.000 |
Hoger
580
Praktisch
390
Middelbaar
850
Europa
90
Nederland
2.240
Buiten Europa
175
Label A
241
Label C
186
Label G
157
Label B
116
Label F
90
Label D
87
Label E
38
Label A+
17
Label A++
3
Label A+++
2
Label A++++
2
Label A+++++
0
| Year | Gas (m3) | Electricity (kWh) |
|---|---|---|
| 2020 | 1.540 | 3.370 |
| 2021 | 1.740 | 3.450 |
| 2022 | 1.330 | 3.310 |
| 2023 | 1.120 | 3.240 |
| 2024 | 1.090 | 3.340 |
Hoekwoning
Gas: 970 • Electricity: 2.440
Huurwoning
Gas: 1.010 • Electricity: 2.550
Koopwoning
Gas: 1.170 • Electricity: 3.480
Appartement
Gas: 700 • Electricity: 2.120
Tussenwoning
Gas: 830 • Electricity: 2.600
Vrijstaande woning
Gas: 1.550 • Electricity: 4.490
Twee-onder-één-kap woning
Gas: 1.100 • Electricity: 3.120
Total number of company establishments: 460
| Period | Crimes |
|---|---|
| jan 2025 | 7 |
| jan 2026 | 1 |
| jul 2025 | 4 |
| jun 2025 | 1 |
| mei 2025 | 0 |
| mrt 2025 | 1 |
| nov 2024 | 1 |
| nov 2025 | 1 |
| okt 2024 | 4 |
| okt 2025 | 1 |
| sep 2024 | 6 |
| sep 2025 | 5 |
These figures give an indicative picture of safety trends in the living environment of Langbroek.
Short answers based on current local statistics, handy for a quick comparison of the living environment.
Langbroek telt in 2025 ongeveer 2.500 inwoners.
De gemiddelde WOZ-waarde in Langbroek is in 2025 circa € 560.000.
Het gemiddelde inkomen per inwoner in Langbroek ligt rond € 36.000 per jaar.
Voor het huidige jaar gaat het om ongeveer 27 geregistreerde misdrijven. Gebruik deze cijfers als indicatie en vergelijk trends per periode.
In Langbroek komt vooral "Vrijstaande woningen" veel voor, met ongeveer 307 woningen.