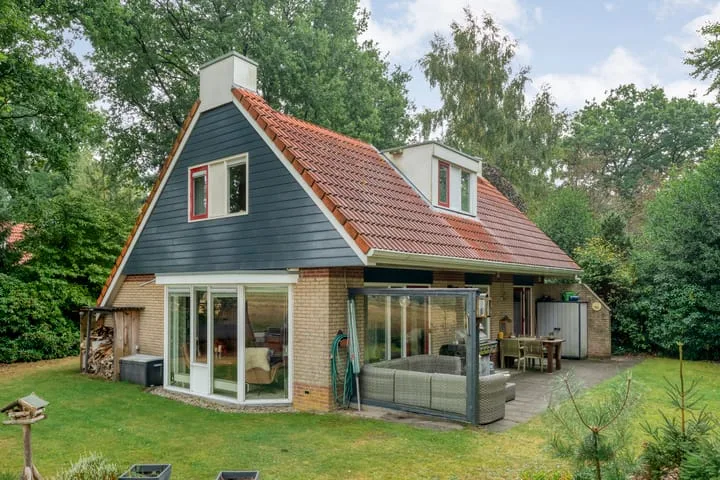
Houses sold in Lemele

View 6 sold houses in Lemele

Connected to: Vastgoed Nederland NVM Makelaars

On this page you will find recently sold homes in Lemele. Use this overview to better estimate selling prices, popular neighborhoods, and the local housing supply before you choose a real estate agent. Also view the current housing supply with 9 houses in Lemele.

Selection

Search and filter homes

Set your preferences and discover homes that suit you.

Total supply 242.628
Filters

Set price, area and other characteristics. Adjust a filter or click on Show homes. Location changes directly above.

Reset filters

You search for

  • Place Lemele
  • Status Sold

Sell your house in Lemele? Compare real estate agents

Bekijk recente verkopen en ontvang gratis offertes van lokale makelaars. Vergelijk meer dan 16 makelaars in Lemele.

Free request a quote

  • Quotes in Lemele
  • Non-binding
  • Personal
  • Compare free rates

Selling your own home in Lemele? Compare real estate agents in Lemele or view the best real estate agents in Lemele as a reference for your choice.

Compare multiple quotes

Real estate agents make sharper offers when they know you're comparing — ask for quotes for sale or purchase.

Frequently asked questions about sold homes in Lemele

Short answers about housing prices, sold homes and comparing real estate agents in Lemele.

Residential and neighborhood statistics in Lemele

View current location data on residents, WOZ development, housing stock, energy consumption, business activity and safety in Lemele. In 2026 were there 1.552 residents. The average WOZ value in 2025 is EUR 489.000.

These figures help to better assess and compare the housing stock in Lemele with recent sold homes. Orient yourself then on suitable top real estate agents in Lemele for sales advice in this region.

Residents

1.552

Last year: 2026

Average WOZ

EUR 489.000

Last year: 2025

Average income per person.

EUR 29.300

Source: AllNumbers

Crimes (current year)

16

Total registered

Demographics and WOZ development

Inhabitants per year

Inhabitants per year in Lemele
Year Residents
2021 1.345
2022 1.350
2023 1.570
2024 1.535
2025 1.560
2026 1.552

Annual WOZ value

WOZ value per year in Lemele
Year Average WOZ
2021 EUR 330.000
2022 EUR 369.000
2023 EUR 453.000
2024 EUR 472.000
2025 EUR 489.000

Composition of residents

Age build-up

65+: 365 0-15: 235 15-25: 205 25-45: 320 45-65: 440

Education level

Hoger

310

Praktisch

240

Middelbaar

630

Origin of residents (2025)

Europa

220

Nederland

1.305

Buiten Europa

30

Housing stock and construction periods

Types of homes

Hoekwoningen 38
Appartementen 40
Tussenwoningen 34
Vrijstaande woningen 337
Twee-onder-één-kap woningen 114

Construction period of buildings

Voor 1700 2
1700 tot 1900 18
1900 tot 1925 33
1925 tot 1950 57
1950 tot 1970 135
1970 tot 1980 71
1980 tot 1990 53
1990 tot 2000 130
2000 tot 2010 85
2010 tot 2020 64
2020 en later 40

Energy and sustainability

Energy label distribution

Label A

145

Label B

129

Label C

84

Label F

76

Label G

72

Label D

38

Label E

17

Label A+++

11

Label A++++

8

Label A+

3

Label A++

3

Label A+++++

0

Average energy consumption per year

Average energy consumption per year in Lemele
Year Gas (m3) Electricity (kWh)
2020 1.670 3.480
2021 1.910 3.700
2022 1.480 3.510
2023 1.220 3.350
2024 1.170 3.480

Consumption per house type

Hoekwoning

Gas: 930 • Electricity: 2.510

Huurwoning

Gas: 1.280 • Electricity: 2.630

Koopwoning

Gas: 1.210 • Electricity: 3.480

Appartement

Gas: 1.220 • Electricity: 2.810

Tussenwoning

Gas: 840 • Electricity: 2.070

Vrijstaande woning

Gas: 1.330 • Electricity: 3.740

Twee-onder-één-kap woning

Gas: 1.080 • Electricity: 2.890

Business activity in Lemele (2025)

Handel en HORECA 30
Nijverheid en energie 20
Zakelijke dienstverlening 35
Overheid, onderwijs en zorg 20
Landbouw, bosbouw en visserij 45
Vervoer, informatie en communicatie 10
Financiele diensten en onroerendgoed 5
Cultuur, recreatie en overige diensten 20

Total number of company establishments: 185

Recent crime statistics

Recent crime statistics in Lemele
Period Crimes
jan 2026 0
jul 2025 0
jun 2025 0
mei 2025 1
mrt 2025 2
mrt 2026 0
nov 2024 4
nov 2025 2
okt 2024 5
okt 2025 0
sep 2024 0
sep 2025 2

These figures give an indicative picture of safety trends in the living environment of Lemele.

Frequently asked questions about living in Lemele

Short answers based on current local statistics, handy for a quick comparison of the living environment.

Hoeveel inwoners heeft Lemele?

Lemele telt in 2026 ongeveer 1.552 inwoners.

Wat is de gemiddelde WOZ-waarde in Lemele?

De gemiddelde WOZ-waarde in Lemele is in 2025 circa € 489.000.

Wat is het gemiddelde inkomen per inwoner in Lemele?

Het gemiddelde inkomen per inwoner in Lemele ligt rond € 29.300 per jaar.

Hoe veilig is wonen in Lemele?

Voor het huidige jaar gaat het om ongeveer 16 geregistreerde misdrijven. Gebruik deze cijfers als indicatie en vergelijk trends per periode.

Welke woningtypen komen het meest voor in Lemele?

In Lemele komt vooral "Vrijstaande woningen" veel voor, met ongeveer 337 woningen.

Receive free, non-binding quotes

Compare multiple real estate agents and choose the best match.