Residents
13.135
Last year: 2025
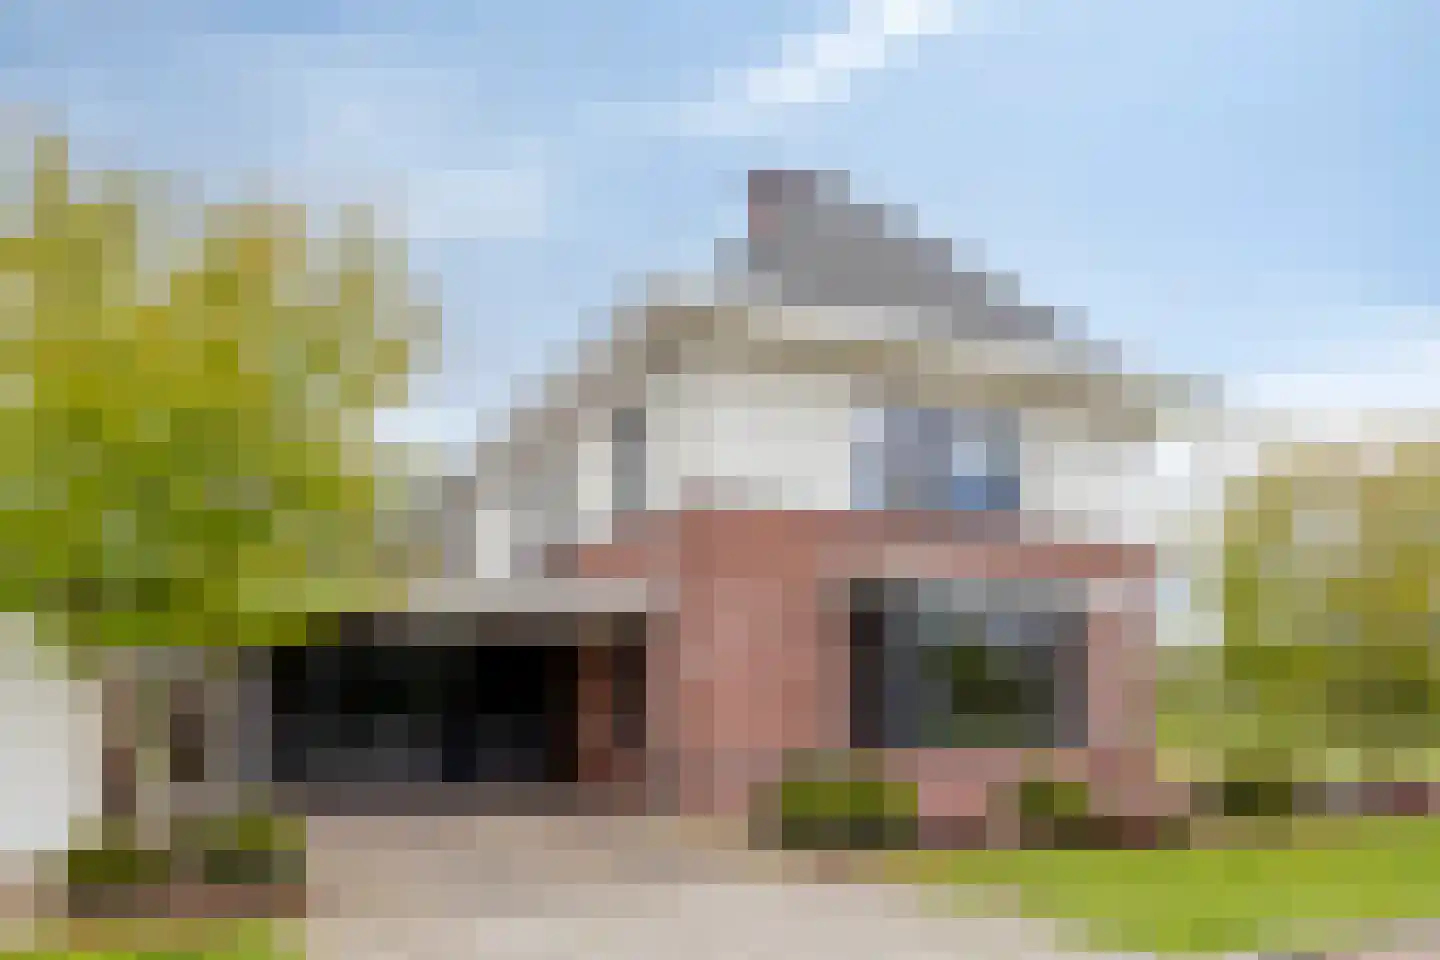
7132EM Lichtenvoorde • Gelderland
€ 750.000 k.k.
Cost of copper (estimated): € 16.850
2% transfer tax (€ 15.000) + notary (€ 1.150) + valuation (€ 700)
Total incl. VAT: € 766.850
For this property, no detailed description is available yet.
€ 750.000
Cost of copper (estimated): € 16.850
2% transfer tax (€ 15.000) + notary (€ 1.150) + valuation (€ 700)
Total purchase (incl. p.p.): € 766.850
3,04%
Yearly
€ 37.500
Direct available
Estimated mortgage
Indicative gross monthly cost
Based on annuity and 30 year term
Indicative net monthly cost
iDisclaimer: this mortgage calculation is a simplified indication based on general assumptions. No rights can be derived from the results shown. Calculated with 10-annual interest (zonder NHG), automatically determined based on the price limit € 470.000. Source: 10-jaars rente uit mortgage_rates (04-05-2026 03:45). For non-NHG, an 80% mortgage of the market value has been used in this indication.
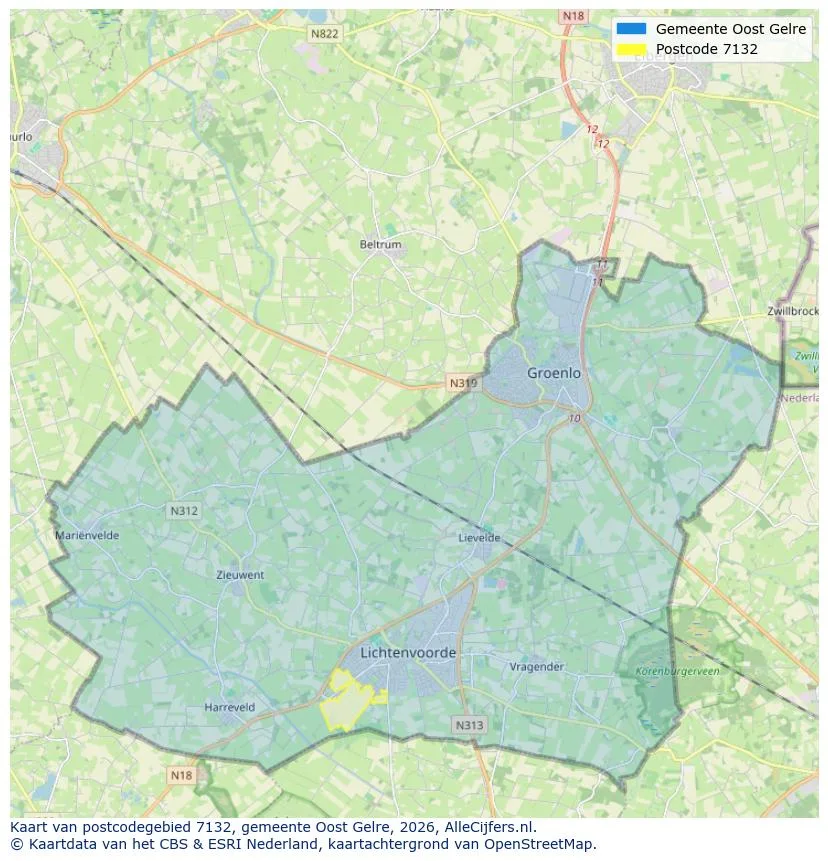
Spatial overview of the work area in Lichtenvoorde
View current location data on residents, WOZ development, housing stock, energy consumption, business activity and safety in Lichtenvoorde. In 2025 were there 13.135 residents. The average WOZ value in 2025 is EUR 334.000.
Residents
13.135
Last year: 2025
Average WOZ
EUR 334.000
Last year: 2025
Average income per person.
EUR 32.400
Source: AllNumbers
Crimes (current year)
241
Total registered
| Year | Residents |
|---|---|
| 2021 | 12.905 |
| 2022 | 12.900 |
| 2023 | 13.010 |
| 2024 | 13.080 |
| 2025 | 13.135 |
| Year | Average WOZ |
|---|---|
| 2021 | EUR 242.000 |
| 2022 | EUR 258.000 |
| 2023 | EUR 285.000 |
| 2024 | EUR 302.000 |
| 2025 | EUR 334.000 |
Hoger
2.670
Praktisch
2.340
Middelbaar
4.540
Europa
520
Nederland
11.945
Buiten Europa
675
Label C
2.067
Label A
1.491
Label B
883
Label D
474
Label F
319
Label G
255
Label E
183
Label A++
141
Label A+
128
Label A++++
44
Label A+++
40
Label A+++++
3
| Year | Gas (m3) | Electricity (kWh) |
|---|---|---|
| 2020 | 1.290 | 2.990 |
| 2021 | 1.460 | 3.030 |
| 2022 | 1.150 | 2.830 |
| 2023 | 920 | 2.690 |
| 2024 | 890 | 2.760 |
Hoekwoning
Gas: 910 • Electricity: 2.510
Huurwoning
Gas: 680 • Electricity: 1.920
Koopwoning
Gas: 1.010 • Electricity: 3.000
Appartement
Gas: 540 • Electricity: 1.790
Tussenwoning
Gas: 840 • Electricity: 2.420
Vrijstaande woning
Gas: 1.260 • Electricity: 3.780
Twee-onder-één-kap woning
Gas: 1.040 • Electricity: 2.990
Total number of company establishments: 1.650
| Period | Crimes |
|---|---|
| jan 2025 | 20 |
| jan 2026 | 13 |
| jul 2025 | 24 |
| jun 2025 | 15 |
| mei 2025 | 16 |
| mrt 2025 | 20 |
| nov 2024 | 29 |
| nov 2025 | 14 |
| okt 2024 | 20 |
| okt 2025 | 23 |
| sep 2024 | 21 |
| sep 2025 | 24 |
These figures give an indicative picture of safety trends in the living environment of Lichtenvoorde.
Short answers based on current local statistics, handy for a quick comparison of the living environment.
Lichtenvoorde telt in 2025 ongeveer 13.135 inwoners.
De gemiddelde WOZ-waarde in Lichtenvoorde is in 2025 circa € 334.000.
Het gemiddelde inkomen per inwoner in Lichtenvoorde ligt rond € 32.400 per jaar.
Voor het huidige jaar gaat het om ongeveer 241 geregistreerde misdrijven. Gebruik deze cijfers als indicatie en vergelijk trends per periode.
In Lichtenvoorde komt vooral "Tussenwoningen" veel voor, met ongeveer 1.824 woningen.
View more homes in this location.
7131EK Lichtenvoorde
€ 425.000 k.k.
7131HB Lichtenvoorde
€ 279.000 k.k.

7131ZM Lichtenvoorde
€ 474.012 k.k.

7131XL Lichtenvoorde
€ 412.500 k.k.

7131BH Lichtenvoorde
€ 289.000 k.k.
7131CJ Lichtenvoorde
€ 339.000 k.k.

7131RC Lichtenvoorde
€ 200.000 k.k.

7131CD Lichtenvoorde
€ 199.000 k.k.
