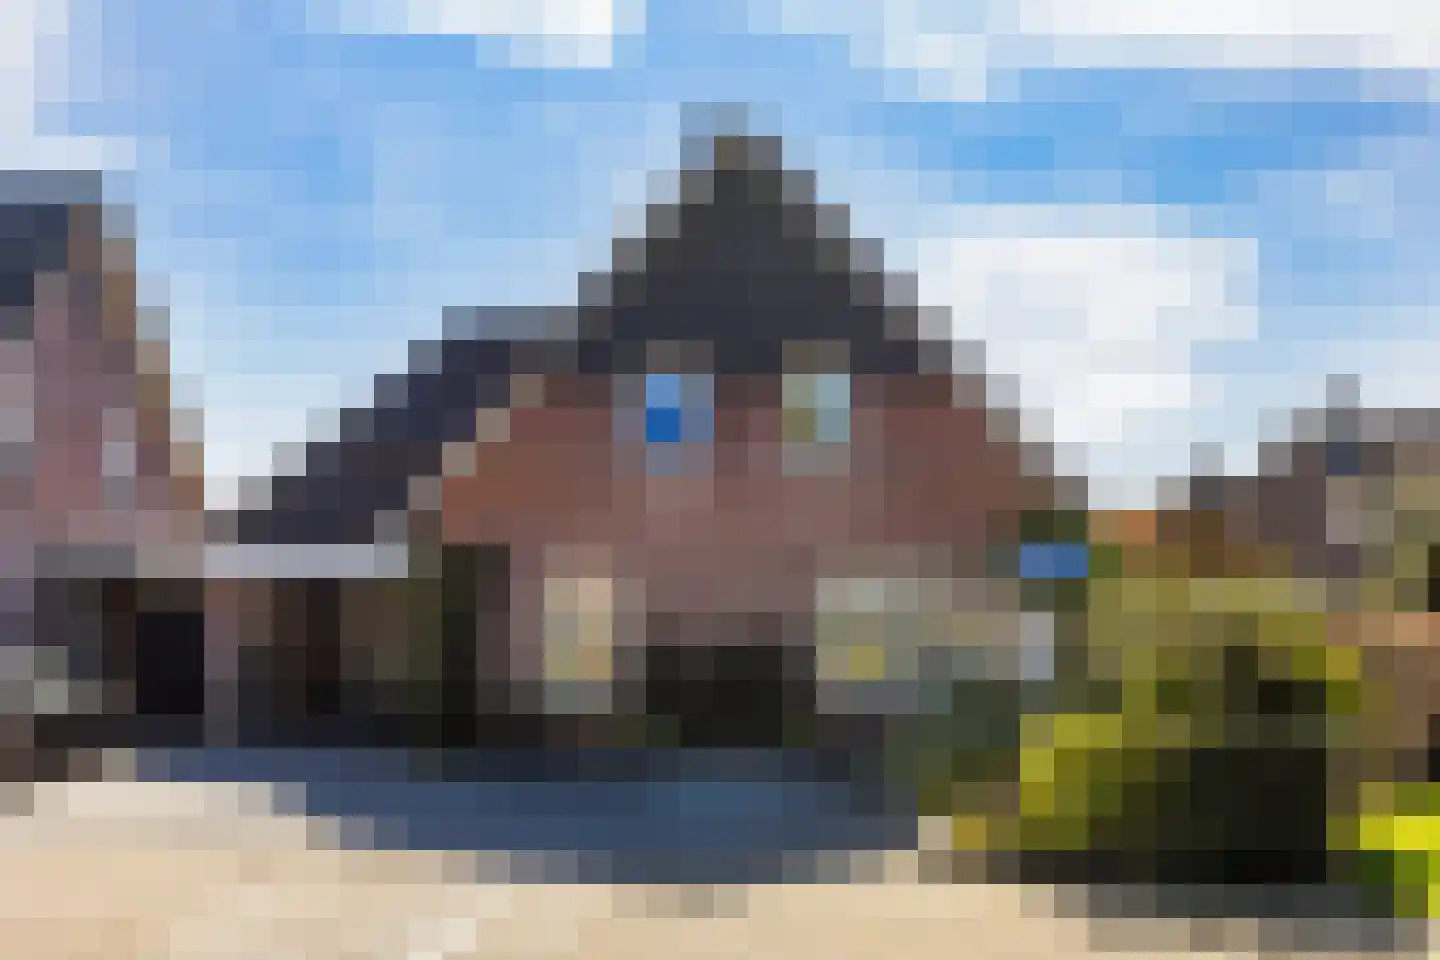
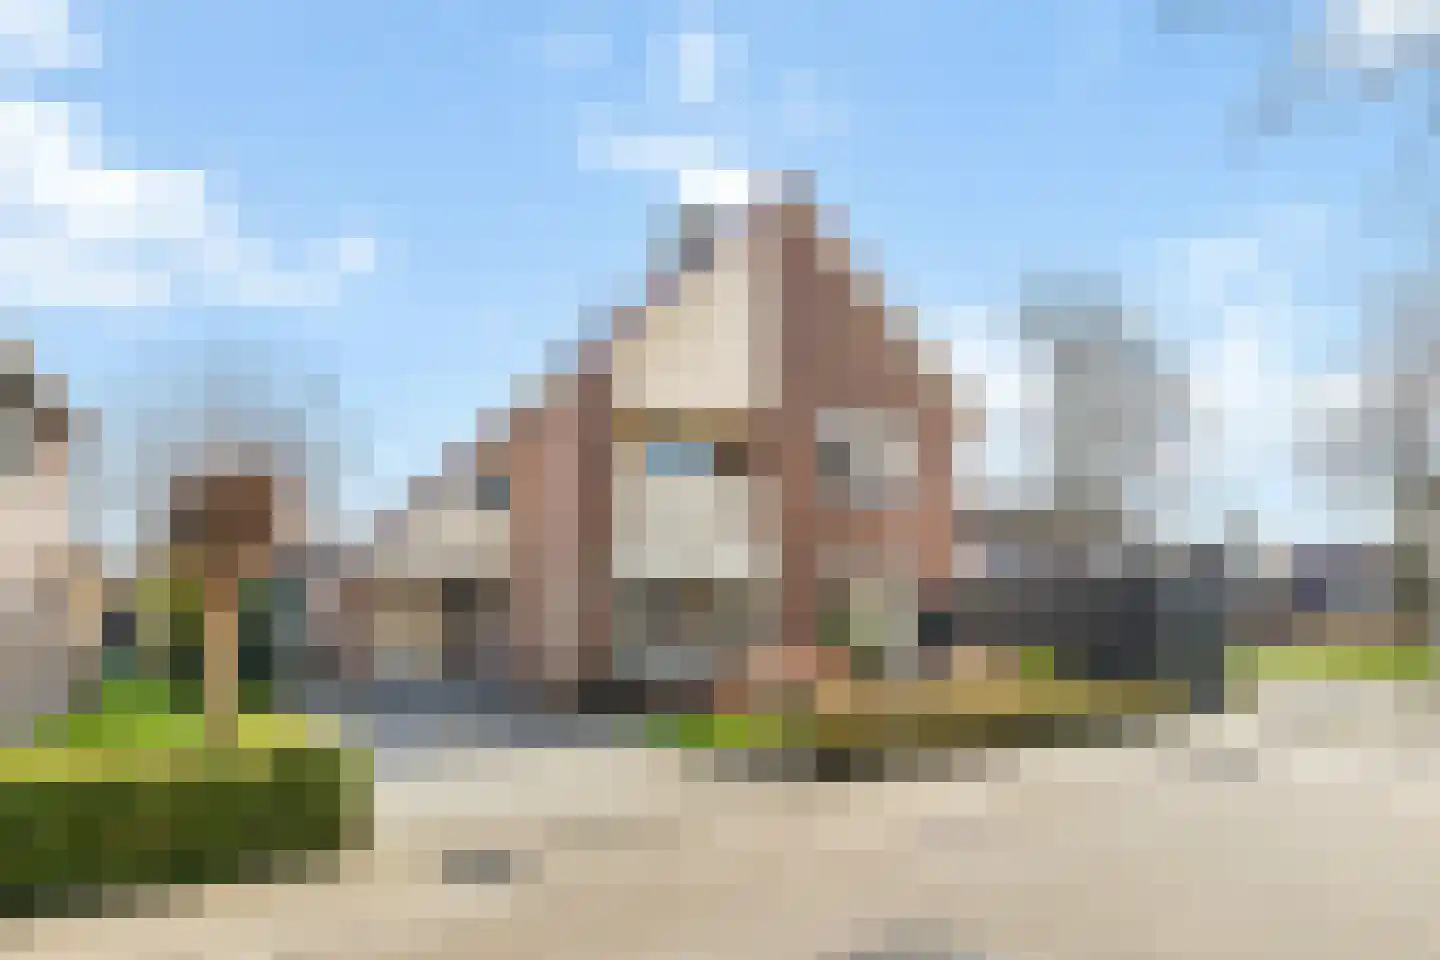
- Available
Reehorst 20
8105BE Luttenberg
€ 599.000 k.k.
€ 2.582/m²
- Living area
- 232 m²
- Land area
- 463 m²
- Bedrooms
- 4
Searching in 12 houses in Luttenberg
Type to search. Use arrow down and arrow up to navigate through results and press Enter to open.
Hidden search suggestions.
View current properties in Luttenberg or search targeted on street, postal code and property characteristics.
View the current housing stock in Luttenberg and quickly filter by price, living area, rooms and more. There are currently 12 houses in this place within our selection. View also 9 sold houses in Luttenberg for extra insight into the local housing market.
8105BE Luttenberg
€ 599.000 k.k.
€ 2.582/m²
8105BE Luttenberg
€ 625.000 k.k.
8105BB Luttenberg
€ 565.500 k.k.
€ 3.107/m²
8105AB Luttenberg
€ 445.000 k.k.
€ 4.320/m²
8105AG Luttenberg
€ 465.000 k.k.
€ 3.206/m²
8105BG Luttenberg
€ 695.000 k.k.
€ 3.278/m²
8105AA Luttenberg
€ 369.000 k.k.
€ 3.843/m²
8105AX Luttenberg
€ 595.000 k.k.
€ 3.672/m²
8105AX Luttenberg
€ 450.000 k.k.
€ 3.214/m²
8105AG Luttenberg
€ 395.000 k.k.
€ 0/m²
8105AB Luttenberg
€ 419.000 k.k.
€ 4.929/m²
8105BK Luttenberg
€ 689.000 k.k.
€ 5.141/m²
Get free quotes from real estate agents with local market knowledge. Compare more than 15 real estate agents in Luttenberg.
Selling a home in Luttenberg? Compare all real estate agents in Luttenberg or view the top 10 real estate agents in Luttenberg for extra context for your choice.
Real estate agents make sharper offers when they know you're comparing — ask for quotes for sale or purchase.
Practical answers about housing supply, sales and comparing real estate agents in Luttenberg.
The costs of a real estate agent in Luttenberg depend on commission, setup costs, property presentation and the chosen service. Compare the 15 real estate agents in Luttenberg via the real estate agent page and request multiple quotes to compare rates and approach well.
Within our selection, we are currently showing 12 houses in Luttenberg. View also the sold houses in Luttenberg to compare the current offering with recent transactions.
Take into account not only price and living area but also maintenance, energy label, location, outdoor space and sales status. This way you compare houses in Luttenberg on more than just the asking price.
A local real estate agent knows the neighborhoods, recent transactions and demand in Luttenberg. By comparing 15 real estate agents in the region you get a better insight into prices, sales strategy and expected yield; the top 10 in Luttenberg provides a useful starting point.
Yes, when making a sales plan, a valuation in Luttenberg is wise. You gain insight into a realistic asking price and can then compare offers from real estate agents specifically.
View current location data on residents, WOZ development, housing stock, energy consumption, business activity and safety in Luttenberg. In 2026 were there 2.347 residents. The average WOZ value in 2025 is EUR 454.000.
These figures help to better assess and compare the housing stock in Luttenberg with recent sold homes. Orient yourself then on suitable top real estate agents in Luttenberg for sales advice in this region.
Residents
2.347
Last year: 2026
Average WOZ
EUR 454.000
Last year: 2025
Average income per person.
EUR 31.500
Source: AllNumbers
Crimes (current year)
11
Total registered
| Year | Residents |
|---|---|
| 2021 | 2.255 |
| 2022 | 2.240 |
| 2023 | 2.250 |
| 2024 | 2.260 |
| 2025 | 2.320 |
| 2026 | 2.347 |
| Year | Average WOZ |
|---|---|
| 2021 | EUR 324.000 |
| 2022 | EUR 355.000 |
| 2023 | EUR 408.000 |
| 2024 | EUR 434.000 |
| 2025 | EUR 454.000 |
Hoger
480
Praktisch
410
Middelbaar
900
Europa
35
Nederland
2.245
Buiten Europa
40
Label C
208
Label A
170
Label B
163
Label G
117
Label D
113
Label F
72
Label E
20
Label A+
8
Label A++++
7
Label A++
5
Label A+++
5
Label A+++++
0
| Year | Gas (m3) | Electricity (kWh) |
|---|---|---|
| 2020 | 1.640 | 3.400 |
| 2021 | 1.860 | 3.460 |
| 2022 | 1.470 | 3.240 |
| 2023 | 1.210 | 3.100 |
| 2024 | 1.150 | 3.210 |
Hoekwoning
Gas: 900 • Electricity: 2.370
Huurwoning
Gas: 1.080 • Electricity: 2.370
Koopwoning
Gas: 1.240 • Electricity: 3.280
Appartement
Gas: 1.130 • Electricity: 3.020
Tussenwoning
Gas: 890 • Electricity: 2.560
Vrijstaande woning
Gas: 1.400 • Electricity: 3.630
Twee-onder-één-kap woning
Gas: 1.120 • Electricity: 2.650
Total number of company establishments: 335
| Period | Crimes |
|---|---|
| jan 2026 | 1 |
| jul 2025 | 2 |
| jun 2025 | 1 |
| mei 2025 | 2 |
| mrt 2025 | 0 |
| mrt 2026 | 3 |
| nov 2024 | 5 |
| nov 2025 | 0 |
| okt 2024 | 3 |
| okt 2025 | 0 |
| sep 2024 | 0 |
| sep 2025 | 2 |
These figures give an indicative picture of safety trends in the living environment of Luttenberg.
Short answers based on current local statistics, handy for a quick comparison of the living environment.
Luttenberg telt in 2026 ongeveer 2.347 inwoners.
De gemiddelde WOZ-waarde in Luttenberg is in 2025 circa € 454.000.
Het gemiddelde inkomen per inwoner in Luttenberg ligt rond € 31.500 per jaar.
Voor het huidige jaar gaat het om ongeveer 11 geregistreerde misdrijven. Gebruik deze cijfers als indicatie en vergelijk trends per periode.
In Luttenberg komt vooral "Vrijstaande woningen" veel voor, met ongeveer 434 woningen.