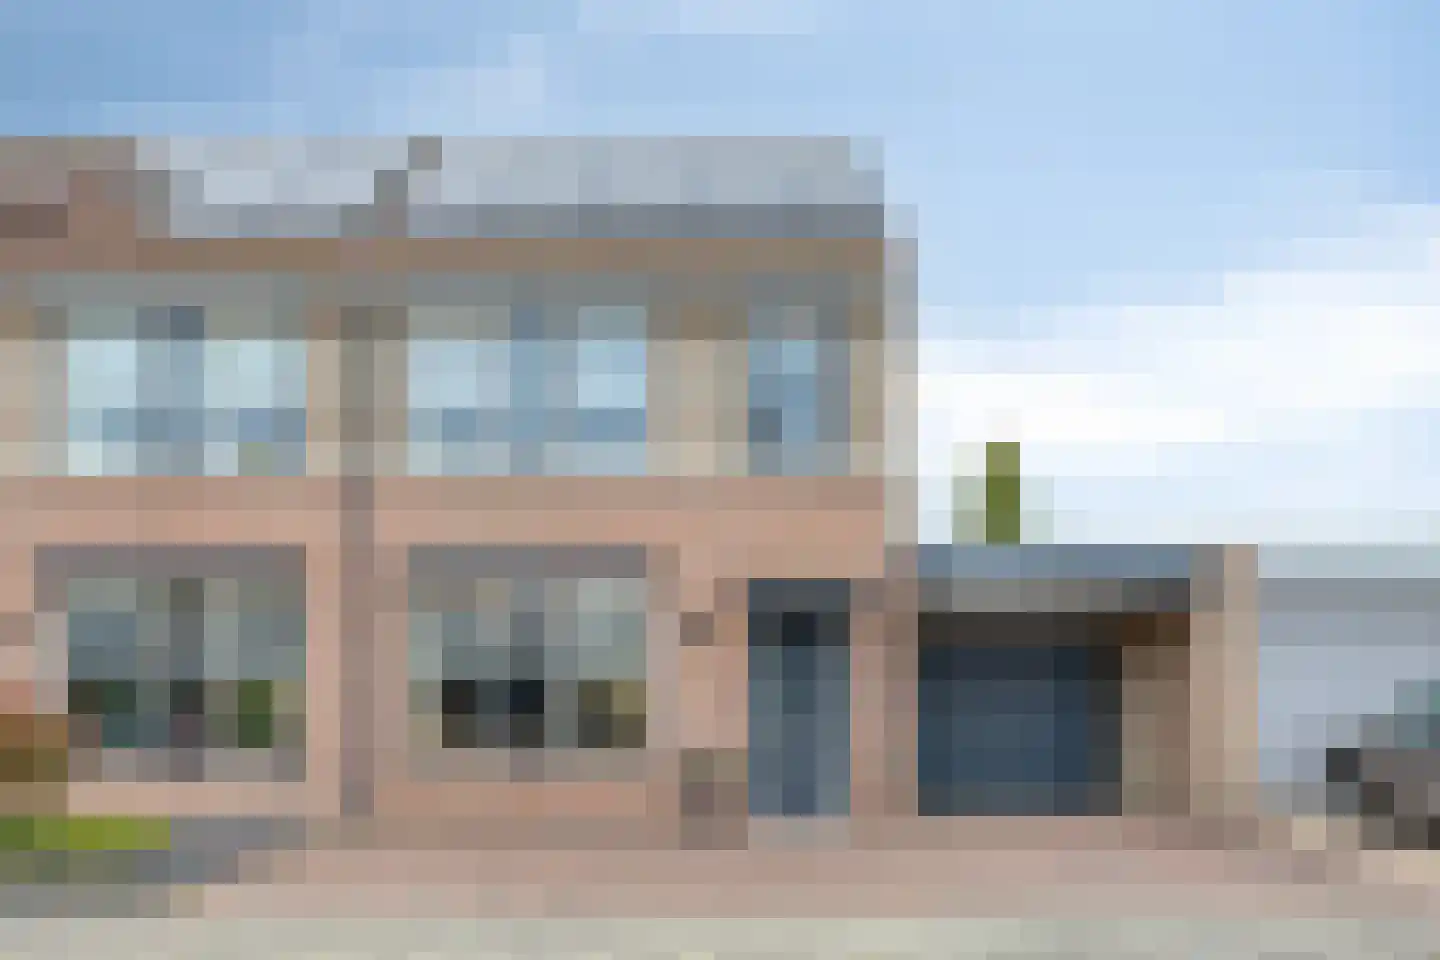
- Sold
Heidehof 56
4921GC Made
€ 399.000 k.k.
€ 3.046/m²
- Living area
- 131 m²
- Land area
- 180 m²
- Bedrooms
- 4
View 104 sold houses in Made
Type to search. Use arrow down and arrow up to navigate through results and press Enter to open.
Hidden search suggestions.
Compare sold homes in Made or view the current offering in this location directly.
On this page you will find recently sold homes in Made. Use this overview to better estimate selling prices, popular neighborhoods, and the local housing supply before you choose a real estate agent. Also view the current housing supply with 168 houses in Made.
4921GC Made
€ 399.000 k.k.
€ 3.046/m²
4921NJ Made
€ 489.000 k.k.
€ 5.041/m²
4921CS Made
€ 395.000 k.k.
€ 4.389/m²
4921AV Made
€ 568.000 k.k.
€ 4.369/m²
4921VL Made
€ 645.000 k.k.
€ 4.542/m²
4921MB Made
€ 420.000 k.k.
€ 4.375/m²
4921ZV Made
€ 795.000 k.k.
€ 4.937/m²
4921ZJ Made
€ 669.000 k.k.
€ 5.767/m²
4921KZ Made
€ 549.000 k.k.
€ 4.463/m²
4921BL Made
€ 595.000 k.k.
€ 3.287/m²
4921CZ Made
€ 320.000 k.k.
€ 4.444/m²
4921AH Made
€ 650.000 k.k.
€ 3.009/m²
4921ZS Made
€ 420.000 k.k.
€ 3.962/m²
4921GB Made
€ 395.000 k.k.
€ 3.526/m²
4921AG Made
€ 550.000 k.k.
€ 3.716/m²
4921WG Made
€ 450.000 k.k.
€ 3.629/m²
4921HL Made
€ 395.000 k.k.
€ 4.702/m²
4921NX Made
€ 679.000 k.k.
€ 5.705/m²
4921MB Made
€ 469.000 k.k.
€ 4.263/m²
4921ND Made
€ 525.000 k.k.
€ 4.772/m²
4921BC Made
€ 390.000 k.k.
€ 4.642/m²
4921TH Made
€ 500.000 k.k.
€ 3.759/m²
4921SX Made
€ 549.000 k.k.
€ 4.537/m²
4921CC Made
Price upon request
4921EX Made
€ 485.000 k.k.
€ 3.514/m²
4921NK Made
€ 649.000 k.k.
€ 5.363/m²
4921TJ Made
€ 459.000 k.k.
€ 4.636/m²
4921LE Made
€ 1.280.000 k.k.
€ 5.589/m²
Bekijk recente verkopen en ontvang gratis offertes van lokale verkoopmakelaars in Made.
Zelf je woning verkopen in Made? Vergelijk verkoopmakelaars in Made of bekijk de beste verkoopmakelaars in Made als referentie bij jouw keuze.
Makelaars maken scherpere voorstellen als ze weten dat je vergelijkt — vraag offertes aan voor verkoop of aankoop.
Short answers about housing prices, sold homes and comparing real estate agents in Made.
The costs of a real estate agent in Made vary per office, property type and sales approach. Therefore, compare multiple quotes and also look at the real estate agents in Made to better compare rates, presentation and local experience.
On this page we currently show 104 sold houses in Made from our selection. This helps you to better assess recent transactions and the local housing market.
Houses sold in Made give insight into asking prices, house types and neighborhoods where recent transactions have taken place. Compare this also with the current housing stock in Made to better understand the market.
You can use sold homes as a first market indication, but a local real estate agent can better take into account finishing, location, maintenance and current demand in Made.
Vergelijk makelaars in Made op lokale verkoopervaring, reviews, verwachte opbrengst, courtage en marketingaanpak. Bekijk verkoopmakelaars in Made of de top 10 makelaars in Made om snel sterke kantoren te ontdekken.
View current location data on residents, WOZ development, housing stock, energy consumption, business activity and safety in Made. In 2025 were there 13.080 residents. The average WOZ value in 2025 is EUR 421.000.
These figures help to better assess and compare the housing stock in Made with recent sold homes. Orient yourself then on suitable top real estate agents in Made for sales advice in this region.
Residents
13.080
Last year: 2025
Average WOZ
EUR 421.000
Last year: 2025
Average income per person.
EUR 34.100
Source: AllNumbers
Crimes (current year)
293
Total registered
| Year | Residents |
|---|---|
| 2021 | 12.470 |
| 2022 | 12.505 |
| 2023 | 12.825 |
| 2024 | 12.965 |
| 2025 | 13.080 |
| Year | Average WOZ |
|---|---|
| 2021 | EUR 292.000 |
| 2022 | EUR 339.000 |
| 2023 | EUR 377.000 |
| 2024 | EUR 419.000 |
| 2025 | EUR 421.000 |
Hoger
2.260
Praktisch
2.800
Middelbaar
4.510
Europa
945
Nederland
11.445
Buiten Europa
695
Label C
1.665
Label A
1.208
Label B
981
Label D
593
Label F
476
Label G
332
Label E
264
Label A+++
221
Label A+
60
Label A++
55
Label A++++
21
Label A+++++
1
| Year | Gas (m3) | Electricity (kWh) |
|---|---|---|
| 2020 | 1.230 | 3.190 |
| 2021 | 1.410 | 3.230 |
| 2022 | 1.080 | 3.040 |
| 2023 | 920 | 2.880 |
| 2024 | 880 | 2.960 |
Hoekwoning
Gas: 890 • Electricity: 2.740
Huurwoning
Gas: 760 • Electricity: 2.280
Koopwoning
Gas: 980 • Electricity: 3.120
Appartement
Gas: 570 • Electricity: 2.000
Tussenwoning
Gas: 770 • Electricity: 2.610
Vrijstaande woning
Gas: 1.250 • Electricity: 3.780
Twee-onder-één-kap woning
Gas: 1.010 • Electricity: 2.980
Total number of company establishments: 1.660
| Period | Crimes |
|---|---|
| jan 2026 | 22 |
| jul 2025 | 16 |
| jun 2025 | 25 |
| mei 2025 | 24 |
| mrt 2025 | 18 |
| mrt 2026 | 25 |
| nov 2024 | 22 |
| nov 2025 | 25 |
| okt 2024 | 24 |
| okt 2025 | 25 |
| sep 2024 | 26 |
| sep 2025 | 36 |
These figures give an indicative picture of safety trends in the living environment of Made.
Short answers based on current local statistics, handy for a quick comparison of the living environment.
Made telt in 2025 ongeveer 13.080 inwoners.
De gemiddelde WOZ-waarde in Made is in 2025 circa € 421.000.
Het gemiddelde inkomen per inwoner in Made ligt rond € 34.100 per jaar.
Voor het huidige jaar gaat het om ongeveer 293 geregistreerde misdrijven. Gebruik deze cijfers als indicatie en vergelijk trends per periode.
In Made komt vooral "Tussenwoningen" veel voor, met ongeveer 1.701 woningen.