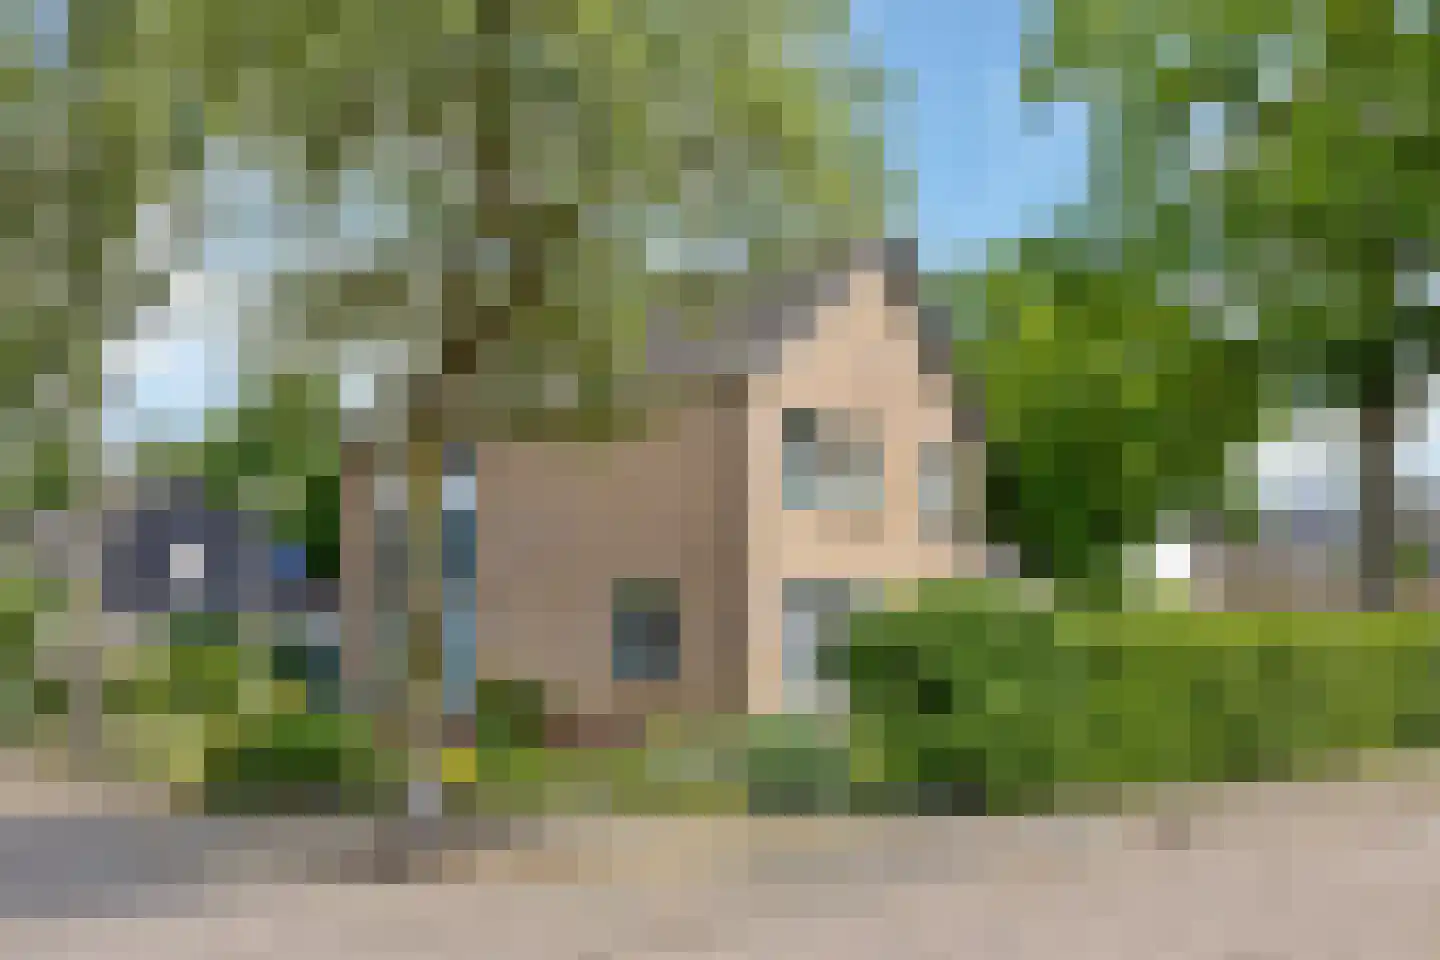
- Sold
het Hobers 4
8106BA Mariënheem
€ 330.000 k.k.
€ 3.333/m²
- Living area
- 99 m²
- Land area
- 156 m²
- Bedrooms
- 3
View 11 sold houses in Mariënheem
Type to search. Use arrow down and arrow up to navigate through results and press Enter to open.
Hidden search suggestions.
Compare sold homes in Mariënheem or view the current offering in this location directly.
On this page you will find recently sold homes in Mariënheem. Use this overview to better estimate selling prices, popular neighborhoods, and the local housing supply before you choose a real estate agent. Also view the current housing supply with 16 houses in Mariënheem.
8106BA Mariënheem
€ 330.000 k.k.
€ 3.333/m²
8106AN Mariënheem
€ 485.000 k.k.
€ 3.345/m²
8106AT Mariënheem
€ 495.000 k.k.
€ 2.946/m²
8106AE Mariënheem
€ 457.500
€ 4.121/m²
8106AE Mariënheem
€ 457.500
€ 4.122/m²
8106AL Mariënheem
€ 395.000 k.k.
€ 0/m²
8106BH Mariënheem
€ 575.000 k.k.
€ 2.963/m²
8106BJ Mariënheem
€ 399.000 k.k.
€ 3.594/m²
8106BH Mariënheem
€ 525.000 k.k.
€ 2.822/m²
8106AT Mariënheem
€ 472.500 k.k.
€ 3.500/m²
8106PC Mariënheem
€ 749.500 k.k.
€ 2.765/m²
Bekijk recente verkopen en ontvang gratis offertes van lokale verkoopmakelaars in Mariënheem.
Zelf je woning verkopen in Mariënheem? Vergelijk verkoopmakelaars in Mariënheem of bekijk de beste verkoopmakelaars in Mariënheem als referentie bij jouw keuze.
Makelaars maken scherpere voorstellen als ze weten dat je vergelijkt — vraag offertes aan voor verkoop of aankoop.
Short answers about housing prices, sold homes and comparing real estate agents in Mariënheem.
The costs of a real estate agent in Mariënheem vary per office, property type and sales approach. Therefore, compare multiple quotes and also look at the real estate agents in Mariënheem to better compare rates, presentation and local experience.
On this page we currently show 11 sold houses in Mariënheem from our selection. This helps you to better assess recent transactions and the local housing market.
Houses sold in Mariënheem give insight into asking prices, house types and neighborhoods where recent transactions have taken place. Compare this also with the current housing stock in Mariënheem to better understand the market.
You can use sold homes as a first market indication, but a local real estate agent can better take into account finishing, location, maintenance and current demand in Mariënheem.
Vergelijk makelaars in Mariënheem op lokale verkoopervaring, reviews, verwachte opbrengst, courtage en marketingaanpak. Bekijk verkoopmakelaars in Mariënheem of de top 10 makelaars in Mariënheem om snel sterke kantoren te ontdekken.
View current location data on residents, WOZ development, housing stock, energy consumption, business activity and safety in Mariënheem. In 2026 were there 1.505 residents. The average WOZ value in 2025 is EUR 462.000.
These figures help to better assess and compare the housing stock in Mariënheem with recent sold homes. Orient yourself then on suitable top real estate agents in Mariënheem for sales advice in this region.
Residents
1.505
Last year: 2026
Average WOZ
EUR 462.000
Last year: 2025
Average income per person.
EUR 32.300
Source: AllNumbers
Crimes (current year)
28
Total registered
| Year | Residents |
|---|---|
| 2021 | 1.490 |
| 2022 | 1.510 |
| 2023 | 1.505 |
| 2024 | 1.490 |
| 2025 | 1.485 |
| 2026 | 1.505 |
| Year | Average WOZ |
|---|---|
| 2021 | EUR 326.000 |
| 2022 | EUR 360.000 |
| 2023 | EUR 412.000 |
| 2024 | EUR 435.000 |
| 2025 | EUR 462.000 |
Hoger
260
Praktisch
270
Middelbaar
590
Europa
25
Nederland
1.440
Buiten Europa
25
Label A
118
Label B
114
Label C
103
Label G
97
Label D
52
Label F
52
Label E
11
Label A+++
6
Label A+
5
Label A++
2
Label A++++
0
Label A+++++
0
| Year | Gas (m3) | Electricity (kWh) |
|---|---|---|
| 2020 | 1.610 | 3.550 |
| 2021 | 1.760 | 3.660 |
| 2022 | 1.370 | 3.520 |
| 2023 | 1.110 | 3.310 |
| 2024 | 1.080 | 3.410 |
Hoekwoning
Gas: 940 • Electricity: 2.890
Huurwoning
Gas: 1.110 • Electricity: 2.670
Koopwoning
Gas: 1.110 • Electricity: 3.450
Appartement
Gas: 1.080 • Electricity: 2.680
Tussenwoning
Gas: 860 • Electricity: 2.480
Vrijstaande woning
Gas: 1.250 • Electricity: 3.830
Twee-onder-één-kap woning
Gas: 1.030 • Electricity: 2.990
Total number of company establishments: 235
| Period | Crimes |
|---|---|
| jan 2026 | 3 |
| jul 2025 | 4 |
| jun 2025 | 3 |
| mei 2025 | 1 |
| mrt 2025 | 1 |
| mrt 2026 | 1 |
| nov 2024 | 4 |
| nov 2025 | 1 |
| okt 2024 | 4 |
| okt 2025 | 3 |
| sep 2024 | 1 |
| sep 2025 | 1 |
These figures give an indicative picture of safety trends in the living environment of Mariënheem.
Short answers based on current local statistics, handy for a quick comparison of the living environment.
Mariënheem telt in 2026 ongeveer 1.505 inwoners.
De gemiddelde WOZ-waarde in Mariënheem is in 2025 circa € 462.000.
Het gemiddelde inkomen per inwoner in Mariënheem ligt rond € 32.300 per jaar.
Voor het huidige jaar gaat het om ongeveer 28 geregistreerde misdrijven. Gebruik deze cijfers als indicatie en vergelijk trends per periode.
In Mariënheem komt vooral "Vrijstaande woningen" veel voor, met ongeveer 300 woningen.