
Residents
9.960
Last year: 2025
1141PD Monnickendam • Noord-Holland
€ 1.195.000 k.k.
Cost of copper (estimated): € 25.750
2% transfer tax (€ 23.900) + notary (€ 1.150) + valuation (€ 700)
Total incl. VAT: € 1.220.750
Purchase price /m²: € 4.561
Overleek 1A, Monnickendam, is een vrijstaande woning van ca. 262 m² op een ruim perceel van 1050 m², gebouwd in 2002. De woning biedt vijf slaapkamers met inbouwkasten, twee badkamers en uitzicht op Broek in Waterland en de Grote Kerk. De ruime woonkamer en serre zijn verbonden via openslaande deuren naar een zonnige tuin. Het huis bevat ook een vrijstaande garage met praktische bijgebouwen, geschikt als werkruimte onder toelating van de gemeente. De ligging biedt rust en ruimte nabij Monnickendam, met goede verbindingen naar Amsterdam, scholen en winkels in de buurt.
€ 1.195.000
Cost of copper (estimated): € 25.750
2% transfer tax (€ 23.900) + notary (€ 1.150) + valuation (€ 700)
Total purchase (incl. p.p.): € 1.220.750
3,21%
Yearly
€ 59.750
Direct available
Estimated mortgage
Indicative gross monthly cost
Based on annuity and 30 year term
Indicative net monthly cost
iDisclaimer: this mortgage calculation is a simplified indication based on general assumptions. No rights can be derived from the results shown. Calculated with 10-annual interest (zonder NHG), automatically determined based on the price limit € 470.000. Source: 10-jaars rente uit mortgage_rates (08-06-2026 03:45). For non-NHG, an 80% mortgage of the market value has been used in this indication.
Elektrische deur, vliering, elektra, verwarming en stromend water
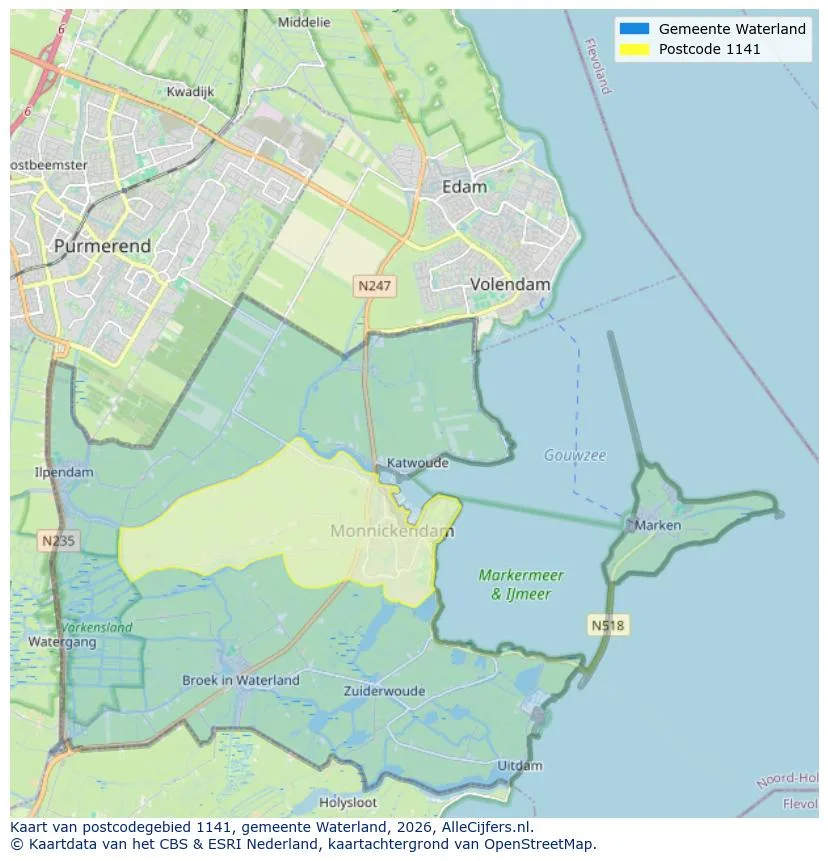
View the location and discover the brokers in this region
View current location data on residents, WOZ development, housing stock, energy consumption, business activity and safety in Monnickendam. In 2025 were there 9.960 residents. The average WOZ value in 2025 is EUR 430.000.
Residents
9.960
Last year: 2025
Average WOZ
EUR 430.000
Last year: 2025
Average income per person.
EUR 36.000
Source: AllNumbers
Crimes (current year)
238
Total registered
| Year | Residents |
|---|---|
| 2021 | 9.605 |
| 2022 | 9.645 |
| 2023 | 9.855 |
| 2024 | 9.900 |
| 2025 | 9.960 |
| Year | Average WOZ |
|---|---|
| 2021 | EUR 343.000 |
| 2022 | EUR 369.000 |
| 2023 | EUR 405.000 |
| 2024 | EUR 414.000 |
| 2025 | EUR 430.000 |
Hoger
2.490
Praktisch
2.130
Middelbaar
2.550
Europa
915
Nederland
7.965
Buiten Europa
1.080
Label C
1.646
Label A
944
Label B
542
Label D
409
Label F
255
Label E
208
Label G
191
Label A+++
98
Label A++++
32
Label A+
27
Label A++
19
Label A+++++
0
| Year | Gas (m3) | Electricity (kWh) |
|---|---|---|
| 2020 | 1.250 | 2.860 |
| 2021 | 1.430 | 2.900 |
| 2022 | 1.100 | 2.670 |
| 2023 | 930 | 2.510 |
| 2024 | 920 | 2.540 |
Hoekwoning
Gas: 1.080 • Electricity: 2.690
Huurwoning
Gas: 720 • Electricity: 2.000
Koopwoning
Gas: 1.040 • Electricity: 2.770
Appartement
Gas: 580 • Electricity: 1.840
Tussenwoning
Gas: 900 • Electricity: 2.490
Vrijstaande woning
Gas: 1.440 • Electricity: 3.680
Twee-onder-één-kap woning
Gas: 1.210 • Electricity: 3.000
Total number of company establishments: 1.375
| Period | Crimes |
|---|---|
| jan 2025 | 21 |
| jan 2026 | 15 |
| jul 2025 | 30 |
| jun 2025 | 31 |
| mei 2025 | 21 |
| mrt 2025 | 17 |
| nov 2024 | 15 |
| nov 2025 | 10 |
| okt 2024 | 10 |
| okt 2025 | 20 |
| sep 2024 | 18 |
| sep 2025 | 25 |
These figures give an indicative picture of safety trends in the living environment of Monnickendam.
Short answers based on current local statistics, handy for a quick comparison of the living environment.
Monnickendam telt in 2025 ongeveer 9.960 inwoners.
De gemiddelde WOZ-waarde in Monnickendam is in 2025 circa € 430.000.
Het gemiddelde inkomen per inwoner in Monnickendam ligt rond € 36.000 per jaar.
Voor het huidige jaar gaat het om ongeveer 238 geregistreerde misdrijven. Gebruik deze cijfers als indicatie en vergelijk trends per periode.
In Monnickendam komt vooral "Tussenwoningen" veel voor, met ongeveer 2.144 woningen.
View more homes in this location.

1141DW Monnickendam
€ 589.000 k.k.
€ 4.638/m²

1141AE Monnickendam
€ 1.150.000 k.k.
€ 7.143/m²

1141HL Monnickendam
€ 1.275.000 k.k.
€ 7.681/m²

1141KR Monnickendam
€ 550.000 k.k.
€ 4.741/m²

1141ZA Monnickendam
€ 450.000 k.k.
€ 4.945/m²

1141TW Monnickendam
€ 500.000 k.k.
€ 7.937/m²

1141TS Monnickendam
€ 495.000 k.k.
€ 7.174/m²

1141GS Monnickendam
€ 798.000 k.k.
€ 5.542/m²
