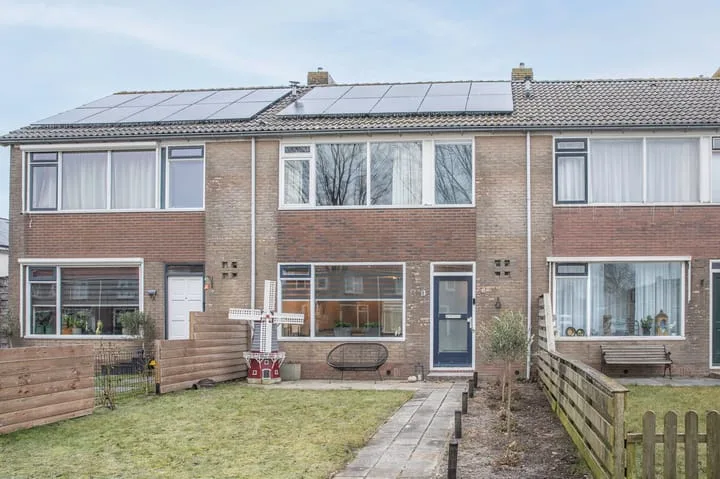
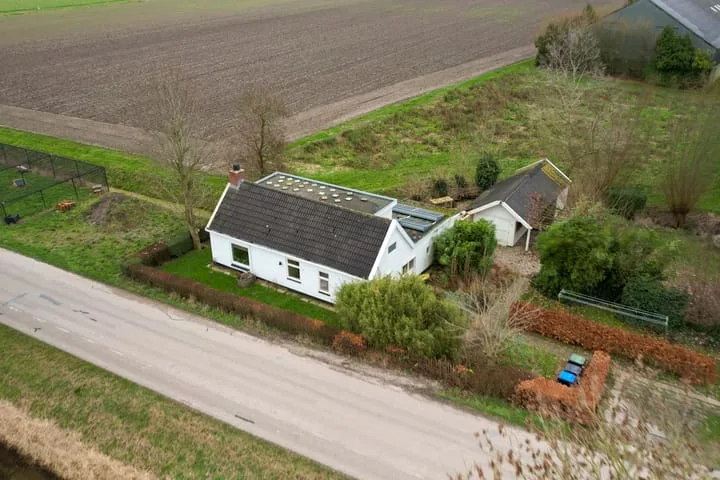
- Sold
Kruisstraat 16
9853PW Munnekezijl
€ 169.000 k.k.
€ 2.485/m²
- Living area
- 68 m²
- Land area
- 223 m²
- Bedrooms
- 2
View 6 sold houses in Munnekezijl
Type to search. Use arrow down and arrow up to navigate through results and press Enter to open.
Hidden search suggestions.
Compare sold homes in Munnekezijl or view the current offering in this location directly.
On this page you will find recently sold homes in Munnekezijl. Use this overview to better estimate selling prices, popular neighborhoods, and the local housing supply before you choose a real estate agent. Also view the current housing supply with 8 houses in Munnekezijl.
9853PW Munnekezijl
€ 169.000 k.k.
€ 2.485/m²
9853PR Munnekezijl
€ 175.000 k.k.
€ 1.548/m²
9853PR Munnekezijl
€ 195.000 k.k.
€ 1.822/m²
9853TB Munnekezijl
€ 295.000 k.k.
€ 3.277/m²
9853PB Munnekezijl
€ 199.500 k.k.
€ 1.975/m²
9853TA Munnekezijl
Price upon request
Bekijk recente verkopen en ontvang gratis offertes van lokale verkoopmakelaars in Munnekezijl.
Zelf je woning verkopen in Munnekezijl? Vergelijk verkoopmakelaars in Munnekezijl of bekijk de beste verkoopmakelaars in Munnekezijl als referentie bij jouw keuze.
Makelaars maken scherpere voorstellen als ze weten dat je vergelijkt — vraag offertes aan voor verkoop of aankoop.
Short answers about housing prices, sold homes and comparing real estate agents in Munnekezijl.
The costs of a real estate agent in Munnekezijl vary per office, property type and sales approach. Therefore, compare multiple quotes and also look at the real estate agents in Munnekezijl to better compare rates, presentation and local experience.
On this page we currently show 6 sold houses in Munnekezijl from our selection. This helps you to better assess recent transactions and the local housing market.
Houses sold in Munnekezijl give insight into asking prices, house types and neighborhoods where recent transactions have taken place. Compare this also with the current housing stock in Munnekezijl to better understand the market.
You can use sold homes as a first market indication, but a local real estate agent can better take into account finishing, location, maintenance and current demand in Munnekezijl.
Vergelijk makelaars in Munnekezijl op lokale verkoopervaring, reviews, verwachte opbrengst, courtage en marketingaanpak. Bekijk verkoopmakelaars in Munnekezijl of de top 10 makelaars in Munnekezijl om snel sterke kantoren te ontdekken.
View current location data on residents, WOZ development, housing stock, energy consumption, business activity and safety in Munnekezijl. In 2025 were there 468 residents. The average WOZ value in 2025 is EUR 254.931.
These figures help to better assess and compare the housing stock in Munnekezijl with recent sold homes. Orient yourself then on suitable top real estate agents in Munnekezijl for sales advice in this region.
Residents
468
Last year: 2025
Average WOZ
EUR 254.931
Last year: 2025
Average income per person.
EUR 21.146
Source: AllNumbers
Crimes (current year)
7
Total registered
| Year | Residents |
|---|---|
| 2021 | 467 |
| 2022 | 472 |
| 2023 | 467 |
| 2024 | 476 |
| 2025 | 468 |
| Year | Average WOZ |
|---|---|
| 2021 | EUR 159.690 |
| 2022 | EUR 192.983 |
| 2023 | EUR 227.603 |
| 2024 | EUR 242.983 |
| 2025 | EUR 254.931 |
Hoger
20
Praktisch
130
Middelbaar
150
Europa
20
Nederland
438
Buiten Europa
15
Label C
79
Label G
52
Label D
34
Label B
32
Label A
19
Label F
14
Label E
10
Label A+
1
Label A+++
1
Label A++
0
Label A++++
0
Label A+++++
0
| Year | Gas (m3) | Electricity (kWh) |
|---|---|---|
| 2020 | 1.527 | 2.515 |
| 2021 | 1.689 | 2.612 |
| 2022 | 1.297 | 2.384 |
| 2023 | 1.064 | 2.311 |
| 2024 | 1.021 | 2.470 |
Hoekwoning
Gas: 592 • Electricity: 1.785
Huurwoning
Gas: 1.074 • Electricity: 1.969
Koopwoning
Gas: 1.074 • Electricity: 2.498
Tussenwoning
Gas: 670 • Electricity: 1.680
Vrijstaande woning
Gas: 1.288 • Electricity: 2.603
Twee-onder-één-kap woning
Gas: 1.071 • Electricity: 2.173
Total number of company establishments: 68
| Period | Crimes |
|---|---|
| jan 2025 | 0 |
| jan 2026 | 1 |
| jul 2025 | 0 |
| jun 2025 | 2 |
| mei 2025 | 1 |
| mrt 2025 | 1 |
| nov 2024 | 1 |
| nov 2025 | 0 |
| okt 2024 | 2 |
| okt 2025 | 0 |
| sep 2024 | 1 |
| sep 2025 | 2 |
These figures give an indicative picture of safety trends in the living environment of Munnekezijl.
Short answers based on current local statistics, handy for a quick comparison of the living environment.
Munnekezijl telt in 2025 ongeveer 468 inwoners.
De gemiddelde WOZ-waarde in Munnekezijl is in 2025 circa € 254.931.
Het gemiddelde inkomen per inwoner in Munnekezijl ligt rond € 21.146 per jaar.
Voor het huidige jaar gaat het om ongeveer 7 geregistreerde misdrijven. Gebruik deze cijfers als indicatie en vergelijk trends per periode.
In Munnekezijl komt vooral "Vrijstaande woningen" veel voor, met ongeveer 100 woningen.