
Residents
10.541
Last year: 2026
6031JE Nederweert • Limburg
€ 529.000 k.k.
Cost of copper (estimated): € 12.430
2% transfer tax (€ 10.580) + notary (€ 1.150) + valuation (€ 700)
Total incl. VAT: € 541.430
For this property, no detailed description is available yet.
€ 529.000
Cost of copper (estimated): € 12.430
2% transfer tax (€ 10.580) + notary (€ 1.150) + valuation (€ 700)
Total purchase (incl. p.p.): € 541.430
3,04%
Yearly
€ 26.450
Direct available
Estimated mortgage
Indicative gross monthly cost
Based on annuity and 30 year term
Indicative net monthly cost
iDisclaimer: this mortgage calculation is a simplified indication based on general assumptions. No rights can be derived from the results shown. Calculated with 10-annual interest (zonder NHG), automatically determined based on the price limit € 470.000. Source: 10-jaars rente uit mortgage_rates (06-05-2026 03:45). For non-NHG, an 80% mortgage of the market value has been used in this indication.
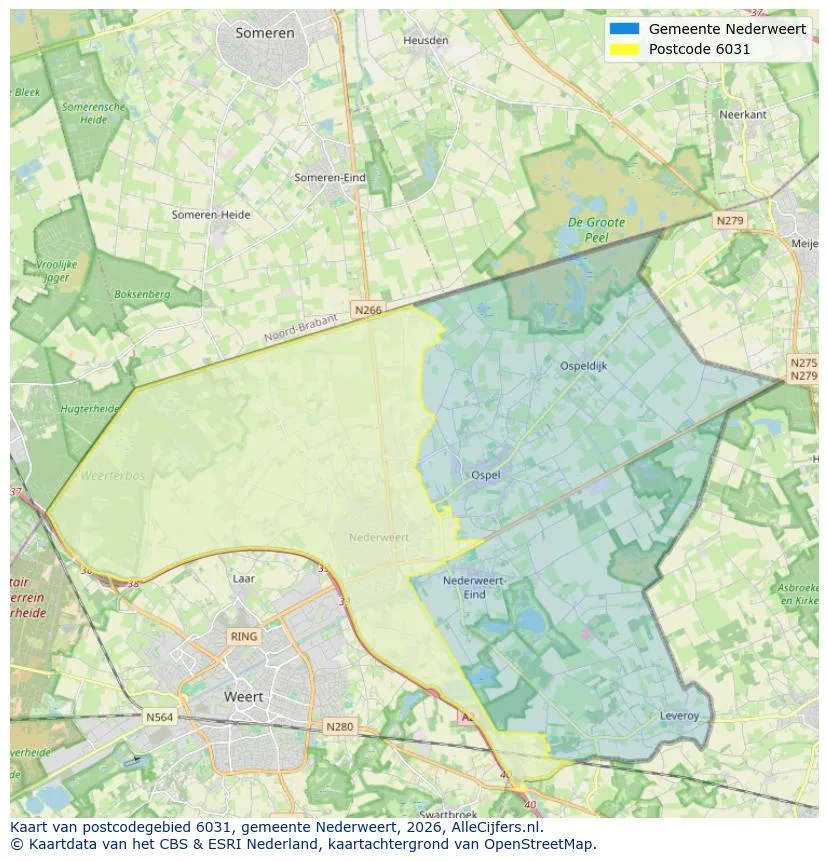
Discover where agents are active in Nederweert
View current location data on residents, WOZ development, housing stock, energy consumption, business activity and safety in Nederweert. In 2026 were there 10.541 residents. The average WOZ value in 2025 is EUR 393.232.
Residents
10.541
Last year: 2026
Average WOZ
EUR 393.232
Last year: 2025
Average income per person.
EUR 27.420
Source: AllNumbers
Crimes (current year)
248
Total registered
| Year | Residents |
|---|---|
| 2021 | 10.410 |
| 2022 | 10.510 |
| 2023 | 10.635 |
| 2024 | 10.595 |
| 2025 | 10.605 |
| 2026 | 10.541 |
| Year | Average WOZ |
|---|---|
| 2021 | EUR 296.408 |
| 2022 | EUR 307.872 |
| 2023 | EUR 361.351 |
| 2024 | EUR 364.267 |
| 2025 | EUR 393.232 |
Hoger
2.090
Praktisch
2.490
Middelbaar
3.160
Europa
775
Nederland
9.175
Buiten Europa
650
Label A
1.473
Label B
1.099
Label C
1.039
Label D
549
Label F
328
Label G
232
Label E
128
Label A+
94
Label A+++
86
Label A++
51
Label A++++
6
Label A+++++
5
| Year | Gas (m3) | Electricity (kWh) |
|---|---|---|
| 2020 | 1.357 | 3.248 |
| 2021 | 1.507 | 3.278 |
| 2022 | 1.173 | 3.081 |
| 2023 | 961 | 2.933 |
| 2024 | 929 | 3.032 |
Hoekwoning
Gas: 943 • Electricity: 2.709
Huurwoning
Gas: 766 • Electricity: 2.173
Koopwoning
Gas: 1.073 • Electricity: 3.327
Appartement
Gas: 535 • Electricity: 1.857
Tussenwoning
Gas: 862 • Electricity: 2.626
Vrijstaande woning
Gas: 1.281 • Electricity: 4.030
Twee-onder-één-kap woning
Gas: 1.014 • Electricity: 2.873
Total number of company establishments: 1.475
| Period | Crimes |
|---|---|
| jan 2026 | 16 |
| jul 2025 | 21 |
| jun 2025 | 20 |
| mei 2025 | 16 |
| mrt 2025 | 26 |
| mrt 2026 | 18 |
| nov 2024 | 27 |
| nov 2025 | 13 |
| okt 2024 | 29 |
| okt 2025 | 19 |
| sep 2024 | 27 |
| sep 2025 | 20 |
These figures give an indicative picture of safety trends in the living environment of Nederweert.
Short answers based on current local statistics, handy for a quick comparison of the living environment.
Nederweert telt in 2026 ongeveer 10.541 inwoners.
De gemiddelde WOZ-waarde in Nederweert is in 2025 circa € 393.232.
Het gemiddelde inkomen per inwoner in Nederweert ligt rond € 27.420 per jaar.
Voor het huidige jaar gaat het om ongeveer 248 geregistreerde misdrijven. Gebruik deze cijfers als indicatie en vergelijk trends per periode.
In Nederweert komt vooral "Vrijstaande woningen" veel voor, met ongeveer 1.346 woningen.
View more homes in this location.

6031CS Nederweert
€ 815.000 k.k.

6031GP Nederweert
€ 590.000 k.k.
€ 3.960/m²

6031GS Nederweert
€ 695.000 k.k.
€ 4.041/m²

6031AR Nederweert
€ 345.000 k.k.
€ 3.317/m²
6031VS Nederweert
€ 450.000 k.k.
€ 3.309/m²

6031BS Nederweert
€ 325.000 k.k.
6031VS Nederweert
€ 369.000 k.k.
€ 2.580/m²

6031EJ Nederweert
€ 475.000 k.k.
€ 2.513/m²
