- Available
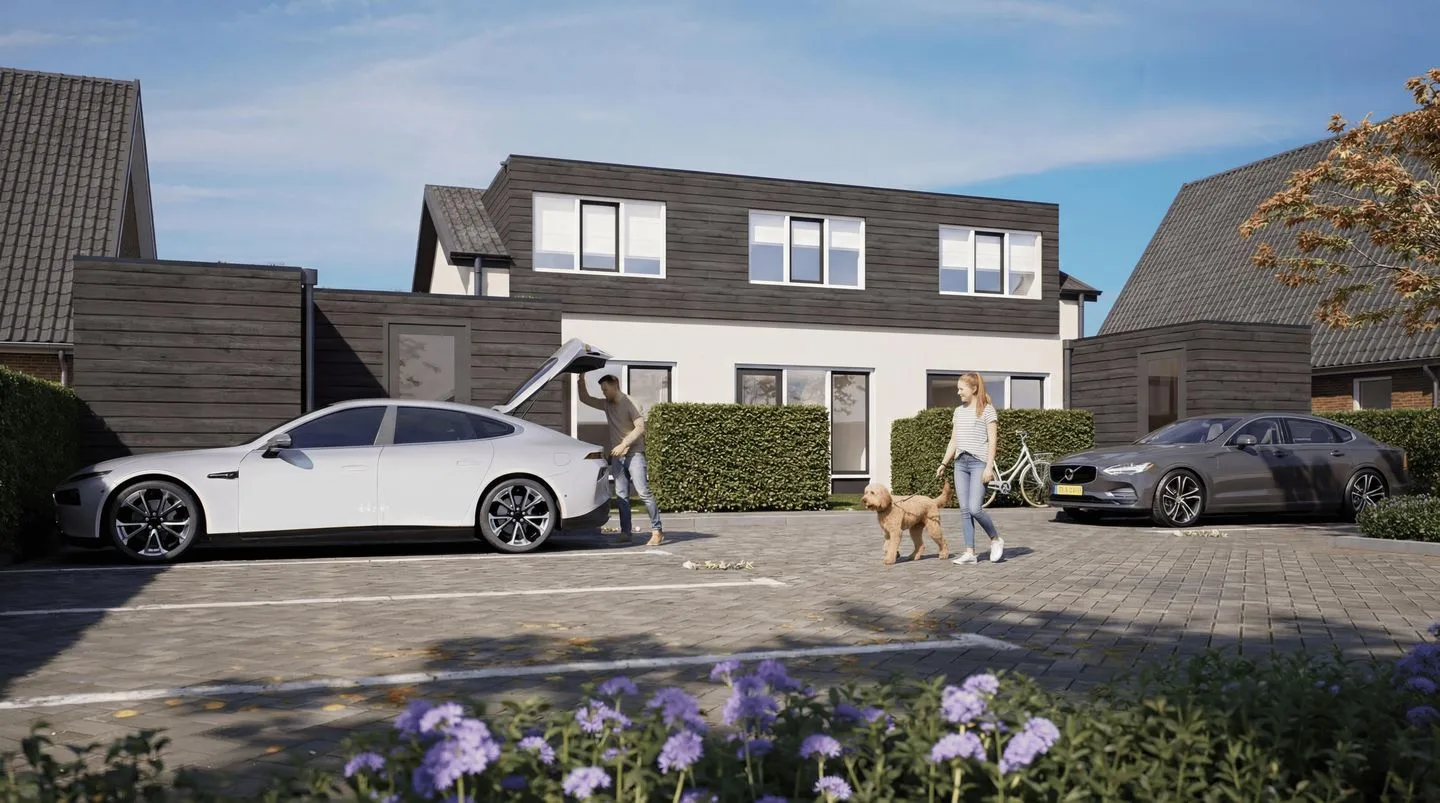
Voorweg 50
2376BC Nieuwe Wetering
€ 1.975.000 k.k.
€ 7.453/m²
A+
Save as favorite
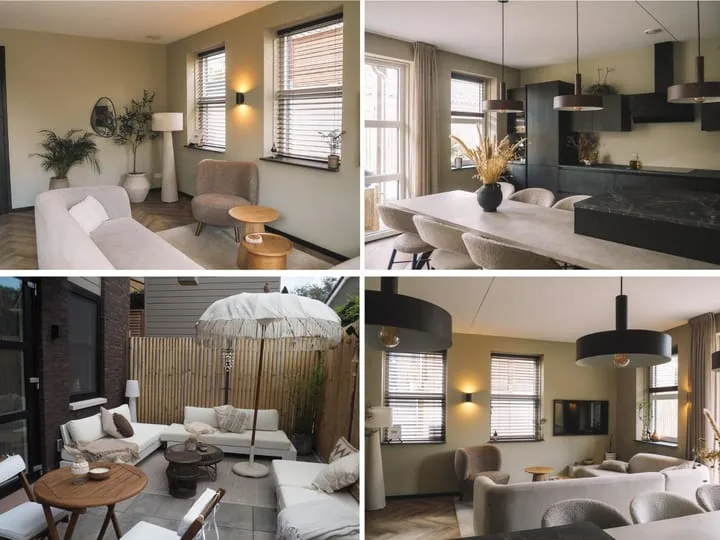
- Living area
- 265 m²
- Land area
- 1835 m²
- Bedrooms
- 5