
Residents
23.435
Last year: 2025
2911RG Nieuwerkerk aan den IJssel • Zuid-Holland
€ 485.000 k.k.
Cost of copper (estimated): € 11.550
2% transfer tax (€ 9.700) + notary (€ 1.150) + valuation (€ 700)
Total incl. VAT: € 496.550
For this property, no detailed description is available yet.
€ 485.000
Cost of copper (estimated): € 11.550
2% transfer tax (€ 9.700) + notary (€ 1.150) + valuation (€ 700)
Total purchase (incl. p.p.): € 496.550
3,04%
Yearly
€ 24.250
Direct available
Estimated mortgage
Indicative gross monthly cost
Based on annuity and 30 year term
Indicative net monthly cost
iDisclaimer: this mortgage calculation is a simplified indication based on general assumptions. No rights can be derived from the results shown. Calculated with 10-annual interest (zonder NHG), automatically determined based on the price limit € 470.000. Source: 10-jaars rente uit mortgage_rates (08-05-2026 03:45). For non-NHG, an 80% mortgage of the market value has been used in this indication.
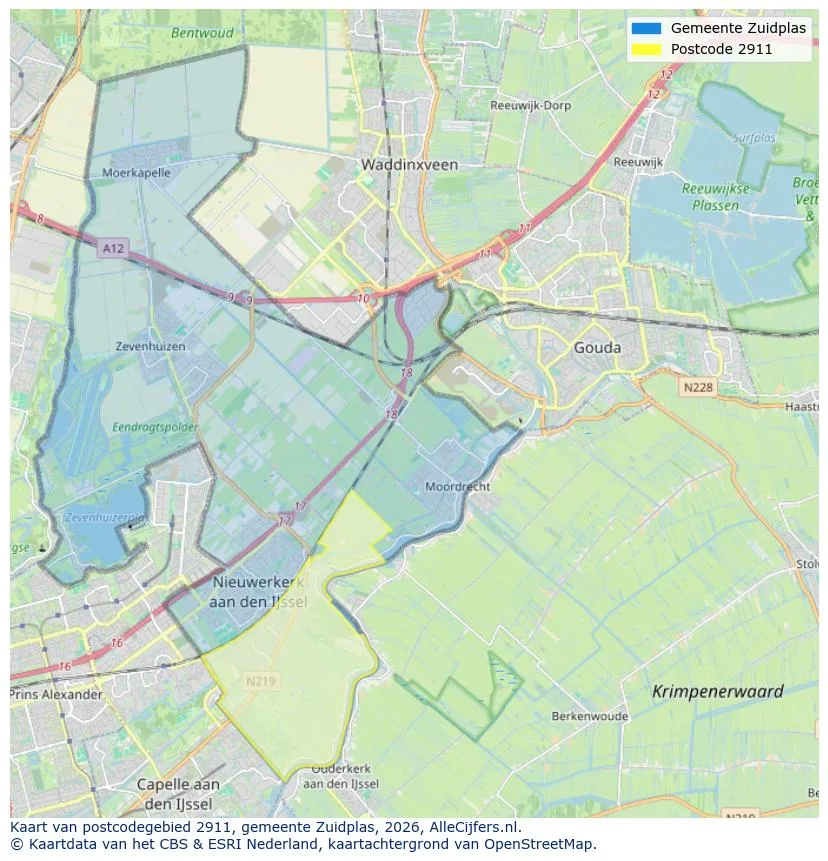
Geographic orientation and real estate agent density in Nieuwerkerk aan den IJssel
View current location data on residents, WOZ development, housing stock, energy consumption, business activity and safety in Nieuwerkerk aan den IJssel. In 2025 were there 23.435 residents. The average WOZ value in 2025 is EUR 449.000.
Residents
23.435
Last year: 2025
Average WOZ
EUR 449.000
Last year: 2025
Average income per person.
EUR 37.700
Source: AllNumbers
Crimes (current year)
948
Total registered
| Year | Residents |
|---|---|
| 2021 | 22.330 |
| 2022 | 22.660 |
| 2023 | 23.135 |
| 2024 | 23.275 |
| 2025 | 23.435 |
| Year | Average WOZ |
|---|---|
| 2021 | EUR 317.000 |
| 2022 | EUR 347.000 |
| 2023 | EUR 412.000 |
| 2024 | EUR 430.000 |
| 2025 | EUR 449.000 |
Hoger
5.800
Praktisch
4.620
Middelbaar
6.990
Europa
1.480
Nederland
18.195
Buiten Europa
3.755
Label C
3.888
Label A
2.366
Label B
1.895
Label D
741
Label E
347
Label G
261
Label F
200
Label A+++
125
Label A+
121
Label A++++
107
Label A++
66
Label A+++++
1
| Year | Gas (m3) | Electricity (kWh) |
|---|---|---|
| 2020 | 1.130 | 3.120 |
| 2021 | 1.230 | 3.190 |
| 2022 | 940 | 2.980 |
| 2023 | 810 | 2.810 |
| 2024 | 790 | 2.900 |
Hoekwoning
Gas: 900 • Electricity: 3.060
Huurwoning
Gas: 630 • Electricity: 2.240
Koopwoning
Gas: 890 • Electricity: 3.070
Appartement
Gas: 590 • Electricity: 2.130
Tussenwoning
Gas: 780 • Electricity: 2.760
Vrijstaande woning
Gas: 1.350 • Electricity: 4.340
Twee-onder-één-kap woning
Gas: 1.010 • Electricity: 3.410
Total number of company establishments: 3.230
| Period | Crimes |
|---|---|
| jan 2025 | 109 |
| jan 2026 | 50 |
| jul 2025 | 82 |
| jun 2025 | 71 |
| mei 2025 | 80 |
| mrt 2025 | 96 |
| nov 2024 | 78 |
| nov 2025 | 59 |
| okt 2024 | 64 |
| okt 2025 | 68 |
| sep 2024 | 72 |
| sep 2025 | 80 |
These figures give an indicative picture of safety trends in the living environment of Nieuwerkerk aan den IJssel.
Short answers based on current local statistics, handy for a quick comparison of the living environment.
Nieuwerkerk aan den IJssel telt in 2025 ongeveer 23.435 inwoners.
De gemiddelde WOZ-waarde in Nieuwerkerk aan den IJssel is in 2025 circa € 449.000.
Het gemiddelde inkomen per inwoner in Nieuwerkerk aan den IJssel ligt rond € 37.700 per jaar.
Voor het huidige jaar gaat het om ongeveer 948 geregistreerde misdrijven. Gebruik deze cijfers als indicatie en vergelijk trends per periode.
In Nieuwerkerk aan den IJssel komt vooral "Tussenwoningen" veel voor, met ongeveer 4.174 woningen.
View more homes in this location.

2911EN Nieuwerkerk aan den IJssel
€ 625.000 k.k.
€ 5.388/m²

2914AG Nieuwerkerk aan den IJssel
€ 500.000 k.k.
€ 4.425/m²

2911CS Nieuwerkerk aan den IJssel
€ 775.000 k.k.
€ 4.814/m²

2911HA Nieuwerkerk aan den IJssel
€ 775.000 k.k.
€ 4.506/m²

2914RG Nieuwerkerk aan den IJssel
€ 500.000 k.k.
€ 5.000/m²

2912CG Nieuwerkerk aan den IJssel
€ 445.000 k.k.
€ 5.057/m²

2914PD Nieuwerkerk aan den IJssel
€ 415.000 k.k.
€ 3.990/m²

2911EJ Nieuwerkerk aan den IJssel
€ 515.000 k.k.
