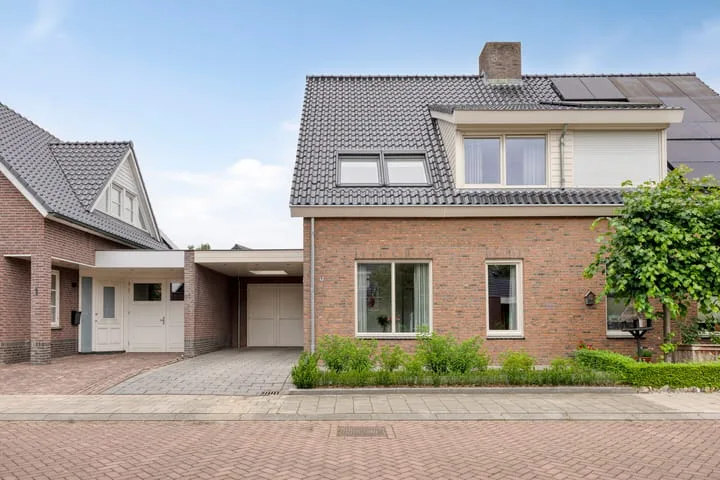
Houses sold in Niftrik

View 3 sold houses in Niftrik

Connected to: Vastgoed Nederland NVM Makelaars

On this page you will find recently sold homes in Niftrik. Use this overview to better estimate selling prices, popular neighborhoods, and the local housing supply before you choose a real estate agent. Also view the current housing supply with 3 houses in Niftrik.

Selection

Search and filter homes

Set your preferences and discover homes that suit you.

Total supply 242.695
Filters

Set price, area and other characteristics. Adjust a filter or click on Show homes. Location changes directly above.

Reset filters

You search for

  • Place Niftrik
  • Status Sold

Sell your house in Niftrik? Compare real estate agents

Bekijk recente verkopen en ontvang gratis offertes van lokale makelaars. Vergelijk meer dan 29 makelaars in Niftrik.

Free request a quote

  • Quotes in Niftrik
  • Non-binding
  • Personal
  • Compare free rates

Selling your own home in Niftrik? Compare real estate agents in Niftrik or view the best real estate agents in Niftrik as a reference for your choice.

Compare multiple quotes

Real estate agents make sharper offers when they know you're comparing — ask for quotes for sale or purchase.

Frequently asked questions about sold homes in Niftrik

Short answers about housing prices, sold homes and comparing real estate agents in Niftrik.

Residential and neighborhood statistics in Niftrik

View current location data on residents, WOZ development, housing stock, energy consumption, business activity and safety in Niftrik. In 2026 were there 420 residents. The average WOZ value in 2025 is EUR 514.000.

These figures help to better assess and compare the housing stock in Niftrik with recent sold homes. Orient yourself then on suitable top real estate agents in Niftrik for sales advice in this region.

Residents

420

Last year: 2026

Average WOZ

EUR 514.000

Last year: 2025

Average income per person.

EUR 32.800

Source: AllNumbers

Crimes (current year)

27

Total registered

Demographics and WOZ development

Inhabitants per year

Inhabitants per year in Niftrik
Year Residents
2021 405
2022 405
2023 410
2024 435
2025 425
2026 420

Annual WOZ value

WOZ value per year in Niftrik
Year Average WOZ
2021 EUR 383.000
2022 EUR 430.000
2023 EUR 469.000
2024 EUR 491.000
2025 EUR 514.000

Composition of residents

Age build-up

65+: 105 0-15: 80 15-25: 60 25-45: 90 45-65: 135

Education level

Hoger

100

Praktisch

90

Middelbaar

150

Origin of residents (2025)

Europa

5

Nederland

410

Buiten Europa

10

Housing stock and construction periods

Types of homes

Hoekwoningen 10
Tussenwoningen 9
Vrijstaande woningen 116
Twee-onder-één-kap woningen 34

Construction period of buildings

Voor 1700 1
1700 tot 1900 4
1900 tot 1925 8
1925 tot 1950 39
1950 tot 1970 34
1970 tot 1980 24
1980 tot 1990 18
1990 tot 2000 28
2000 tot 2010 29
2010 tot 2020 4
2020 en later 10

Energy and sustainability

Energy label distribution

Label A

37

Label C

35

Label G

25

Label B

24

Label D

16

Label F

15

Label E

12

Label A+

2

Label A+++

2

Label A++

1

Label A++++

0

Label A+++++

0

Average energy consumption per year

Average energy consumption per year in Niftrik
Year Gas (m3) Electricity (kWh)
2020 1.760 4.100
2021 1.960 4.050
2022 1.530 3.940
2023 1.220 3.830
2024 1.220 3.870

Consumption per house type

Hoekwoning

Gas: 870 • Electricity: 3.040

Huurwoning

Gas: 730 • Electricity: 3.100

Koopwoning

Gas: 1.290 • Electricity: 3.920

Tussenwoning

Gas: 750 • Electricity: 2.870

Vrijstaande woning

Gas: 1.380 • Electricity: 4.180

Twee-onder-één-kap woning

Gas: 940 • Electricity: 3.150

Business activity in Niftrik (2025)

Handel en HORECA 20
Nijverheid en energie 20
Zakelijke dienstverlening 15
Overheid, onderwijs en zorg 10
Landbouw, bosbouw en visserij 10
Vervoer, informatie en communicatie 5
Financiele diensten en onroerendgoed 0
Cultuur, recreatie en overige diensten 10

Total number of company establishments: 95

Recent crime statistics

Recent crime statistics in Niftrik
Period Crimes
jan 2026 1
jul 2025 3
jun 2025 2
mei 2025 3
mrt 2025 1
mrt 2026 0
nov 2024 2
nov 2025 4
okt 2024 1
okt 2025 2
sep 2024 2
sep 2025 0

These figures give an indicative picture of safety trends in the living environment of Niftrik.

Frequently asked questions about living in Niftrik

Short answers based on current local statistics, handy for a quick comparison of the living environment.

Hoeveel inwoners heeft Niftrik?

Niftrik telt in 2026 ongeveer 420 inwoners.

Wat is de gemiddelde WOZ-waarde in Niftrik?

De gemiddelde WOZ-waarde in Niftrik is in 2025 circa € 514.000.

Wat is het gemiddelde inkomen per inwoner in Niftrik?

Het gemiddelde inkomen per inwoner in Niftrik ligt rond € 32.800 per jaar.

Hoe veilig is wonen in Niftrik?

Voor het huidige jaar gaat het om ongeveer 27 geregistreerde misdrijven. Gebruik deze cijfers als indicatie en vergelijk trends per periode.

Welke woningtypen komen het meest voor in Niftrik?

In Niftrik komt vooral "Vrijstaande woningen" veel voor, met ongeveer 116 woningen.

Receive free, non-binding quotes

Compare multiple real estate agents and choose the best match.