HW Makelaardij Wijchen
In Wijchen staat HW Makelaardij voor betrouwbare en persoonlijke makelaarsdienst. Met een sterke focus op klantgerichtheid en kennis van de regio, helpen we u bij het vinden of verkopen van uw woning of bedrijfsruimte. Onze belofte is om transparant, geduldig en deskundig te zijn in elk stapje van het proces. We bieden diensten als verkoop, aankoop en taxaties aan. Onze werkwijze is gericht op het vinden van de beste oplossing voor onze...
Current housing stock
-
- Available
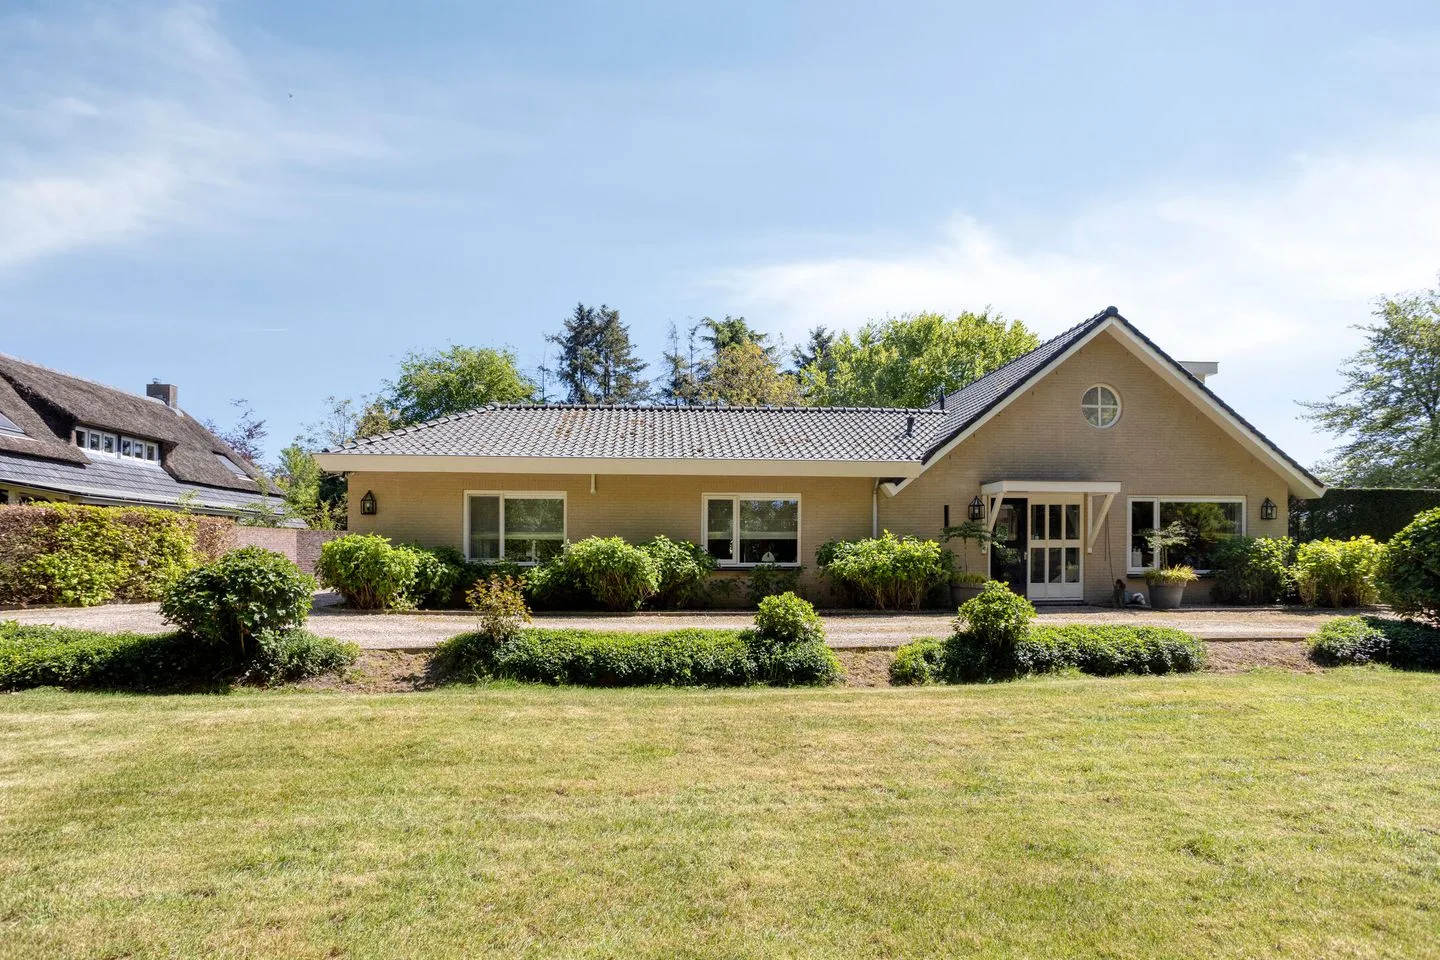
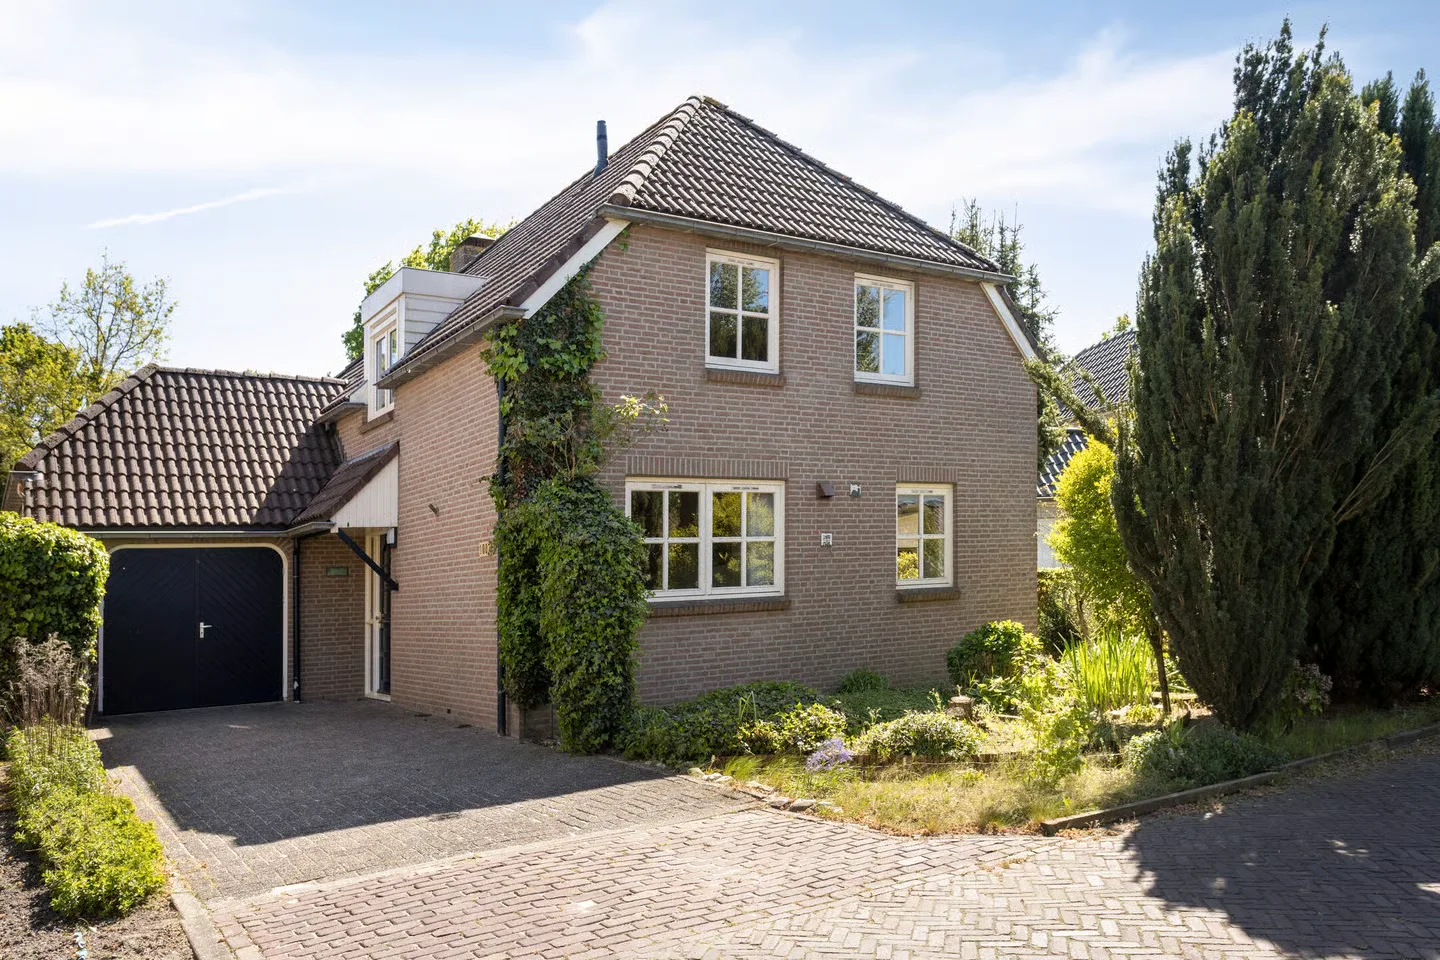
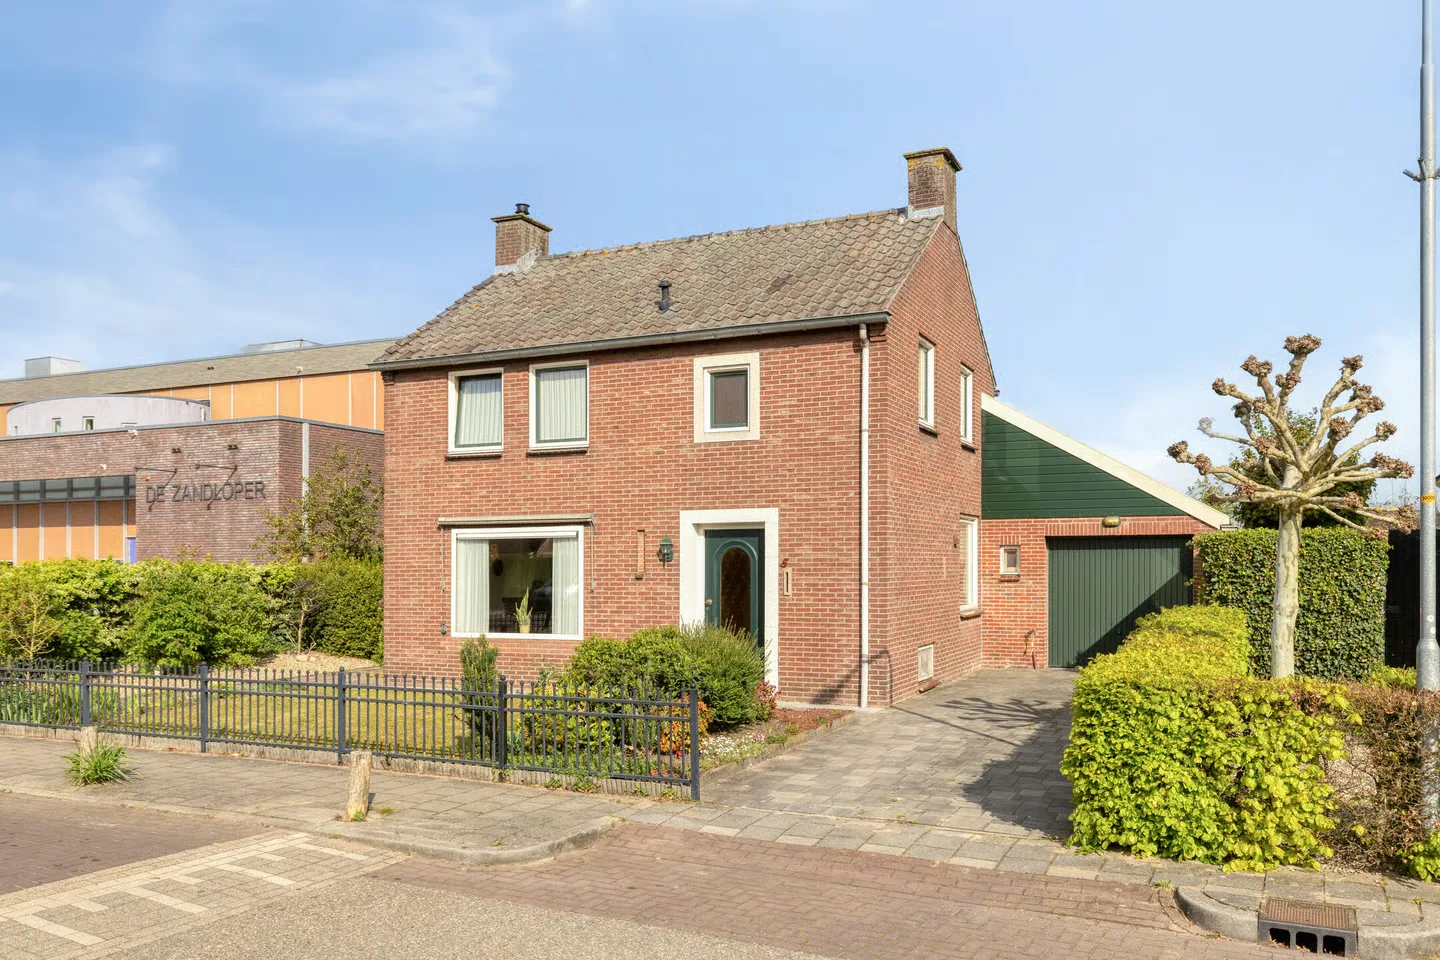
de Weem 5
6617BG Bergharen
€ 478.000 k.k.
GSave as favorite- Living area
- 119 m²
- Land area
- 423 m²
- Bedrooms
- 3
-
- Available
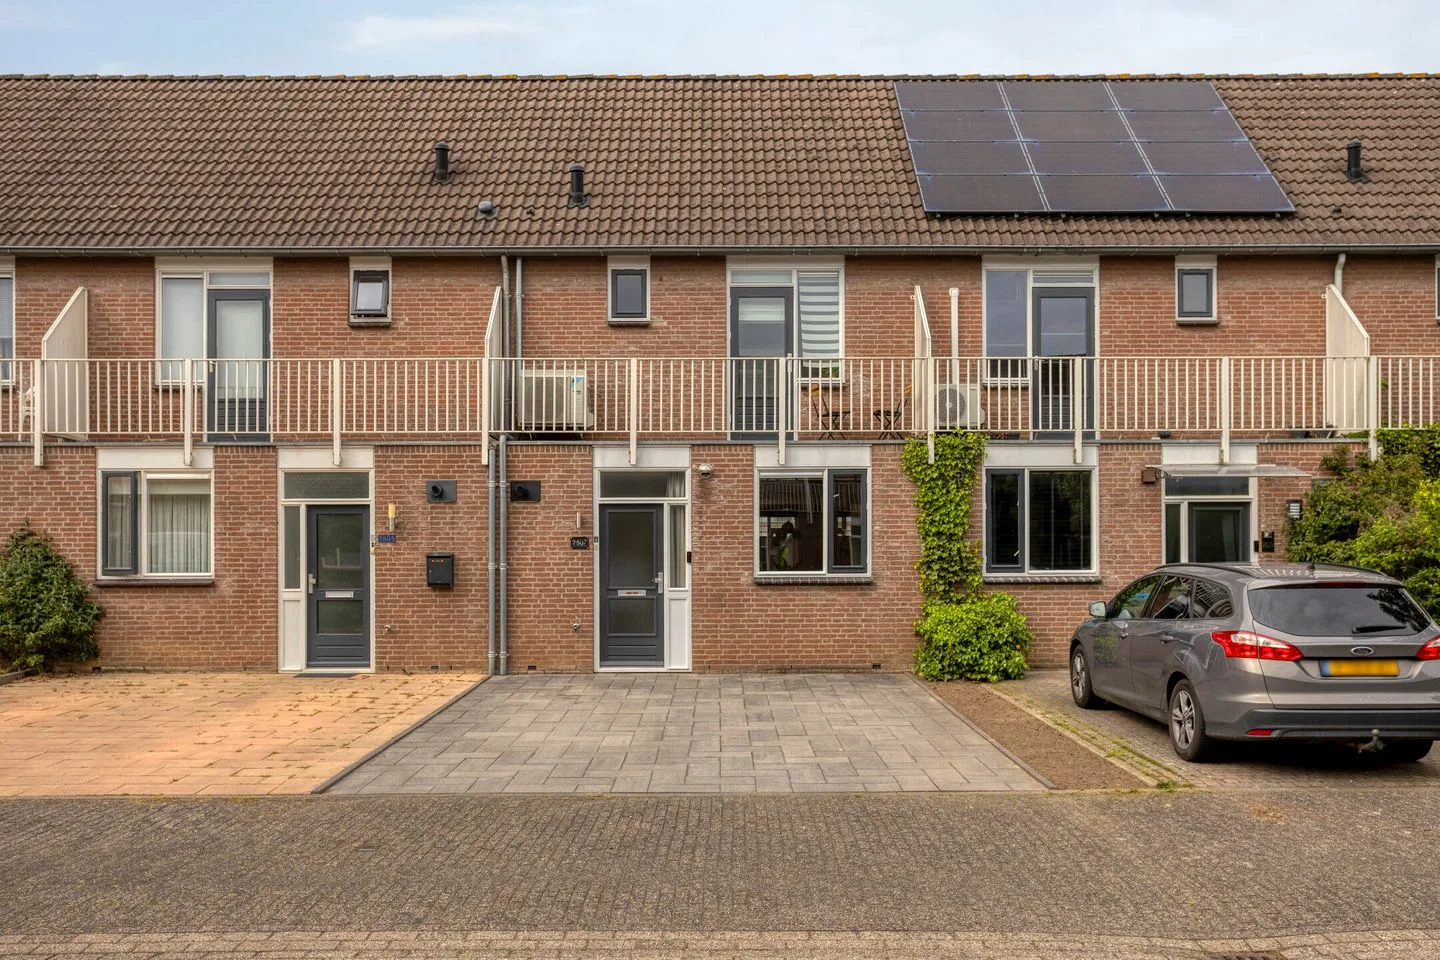
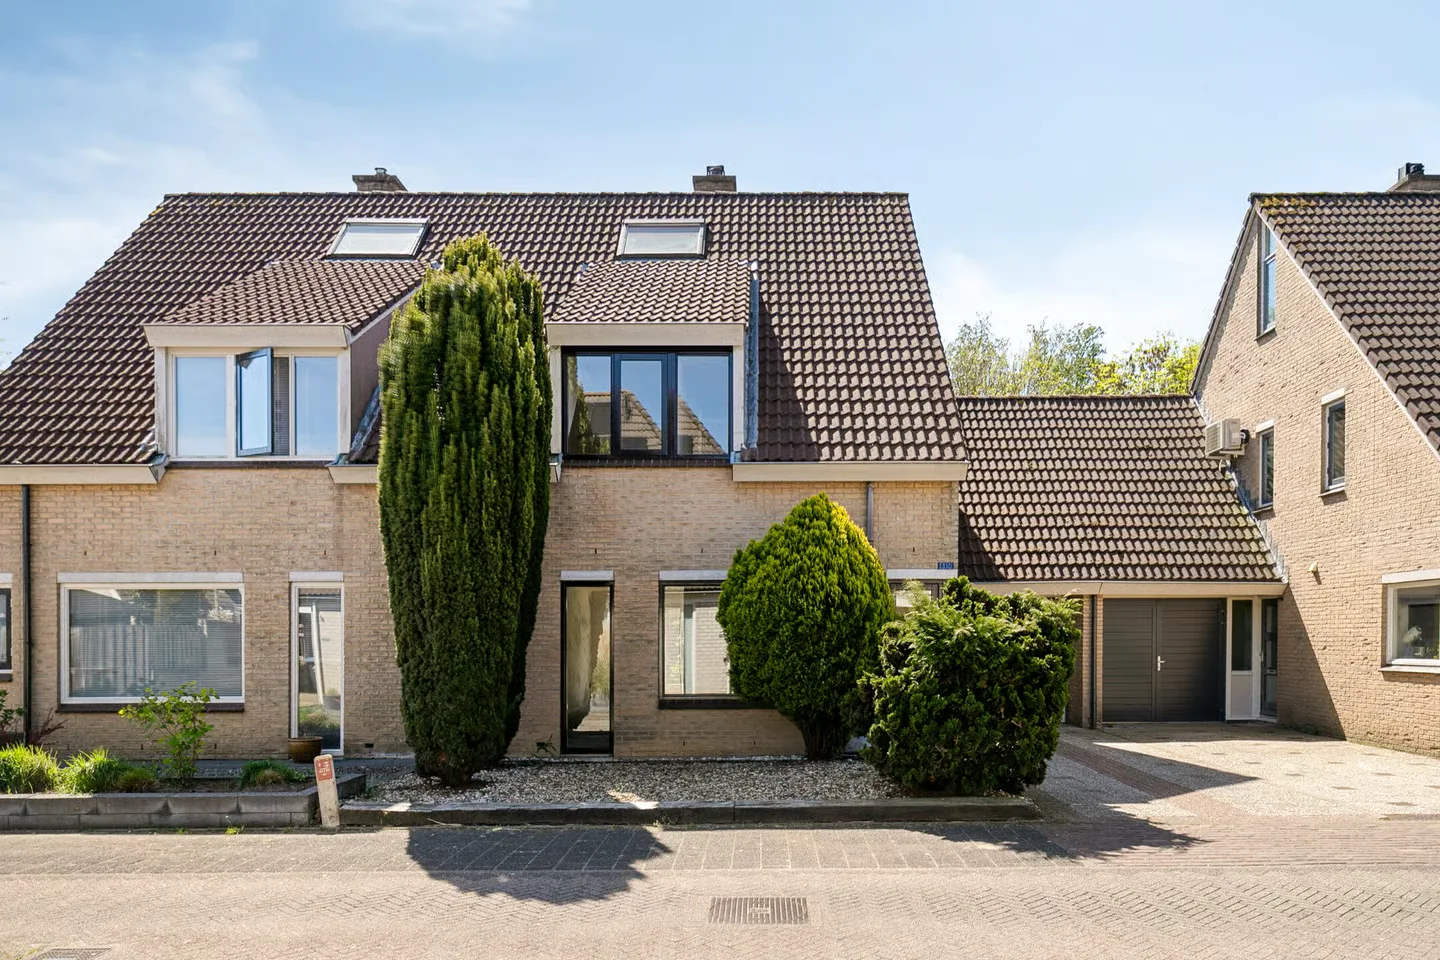
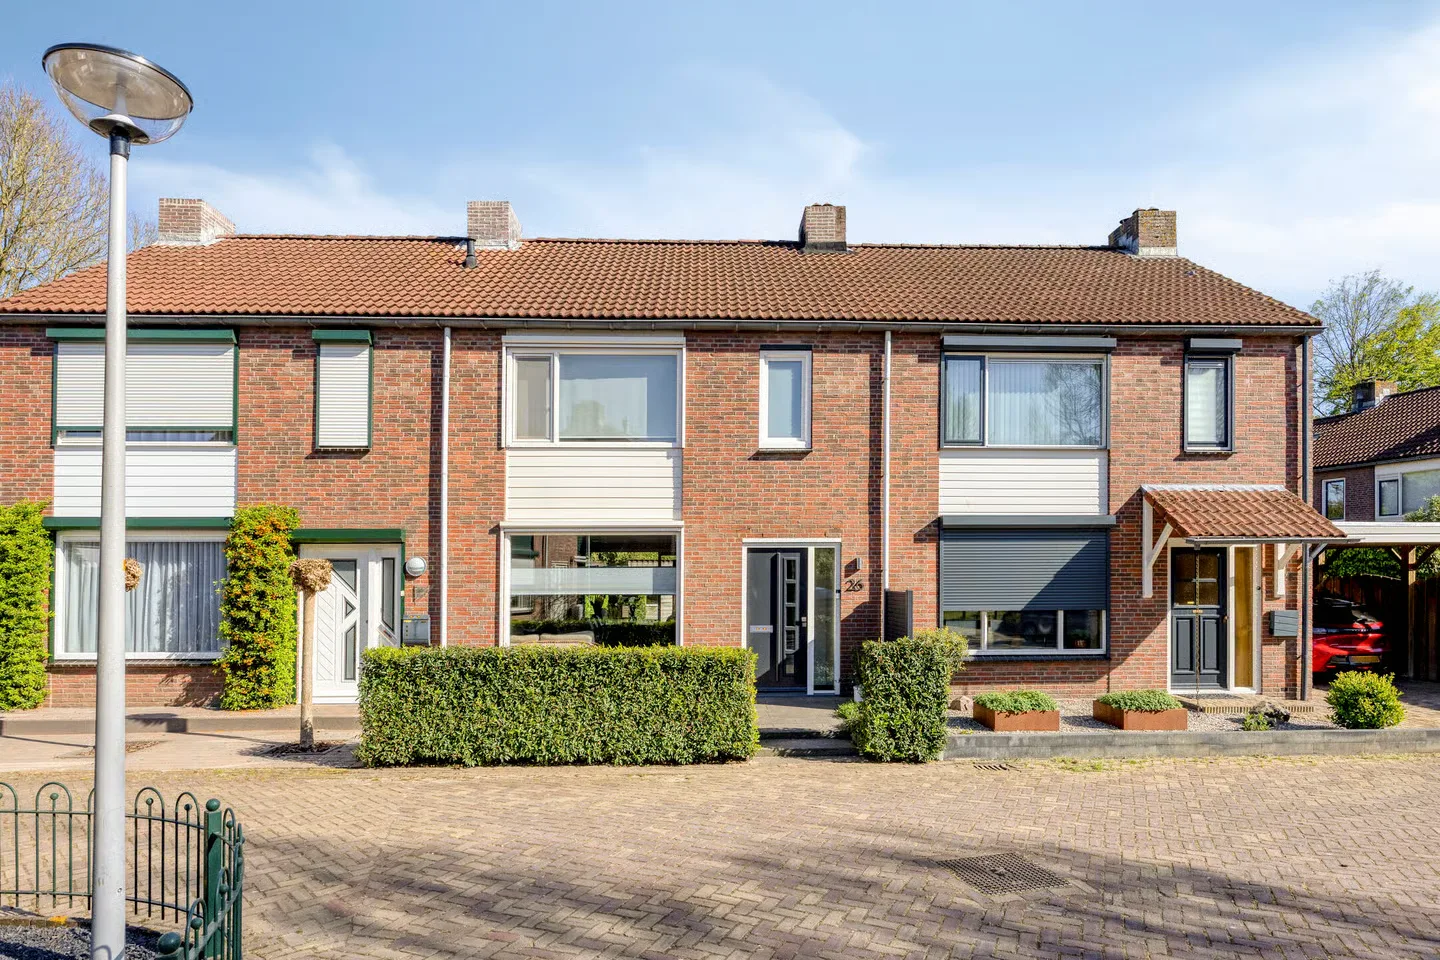
Olmenhof 26
6602EZ Wijchen
€ 399.000 k.k.
ASave as favorite- Living area
- 108 m²
- Land area
- 164 m²
- Bedrooms
- 4
-
- Available
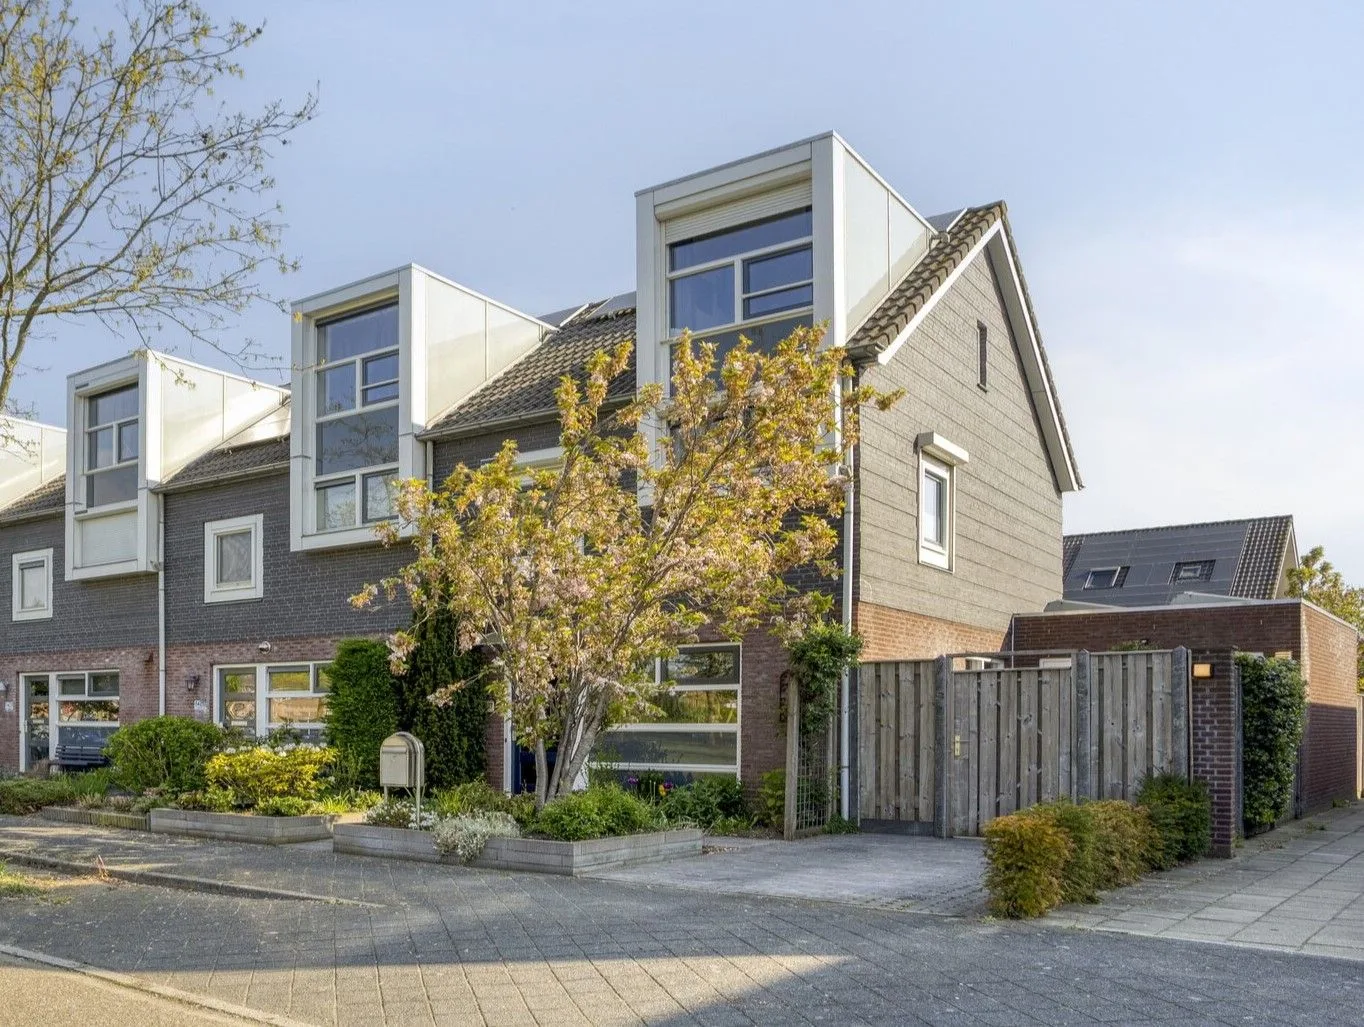
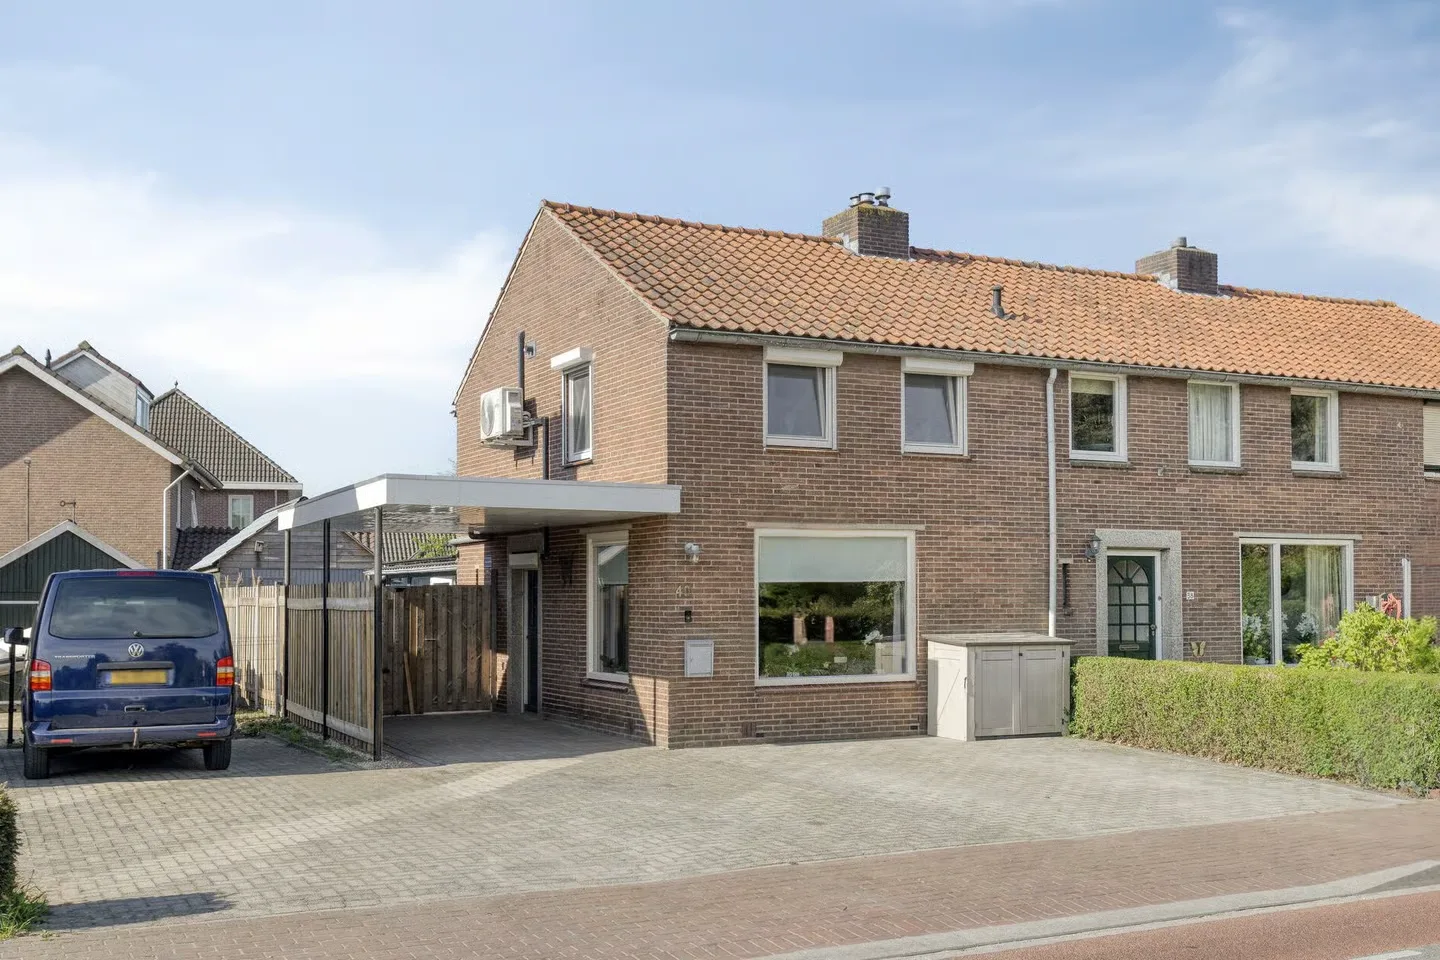
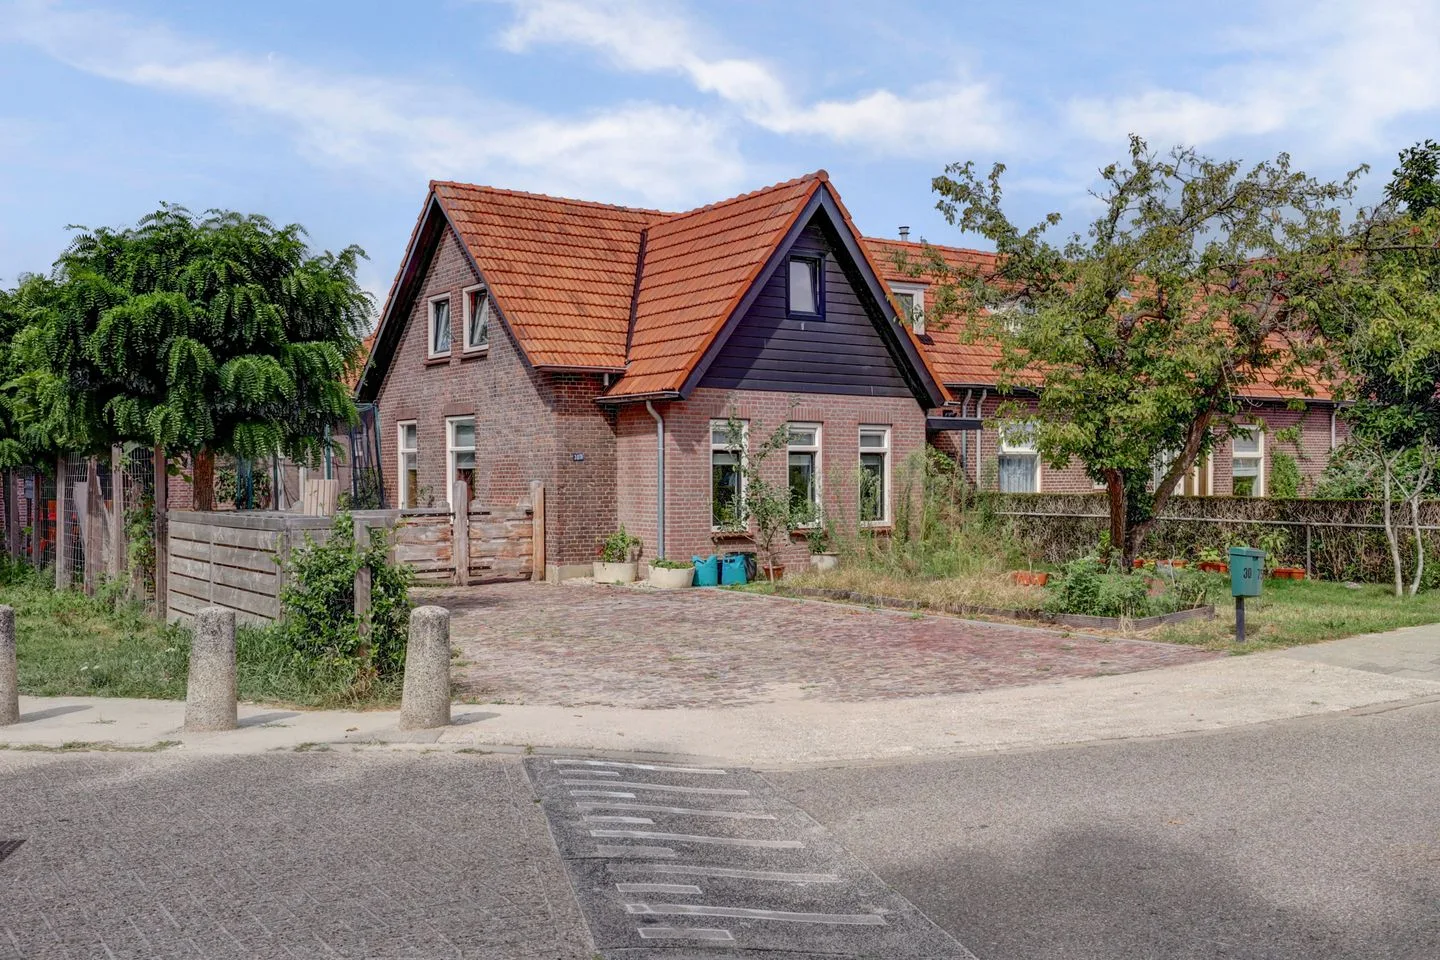
Broekstraat 40
6612AC Nederasselt
€ 395.000 k.k.
ASave as favorite- Living area
- 84 m²
- Land area
- 217 m²
- Bedrooms
- 2
-
- Available
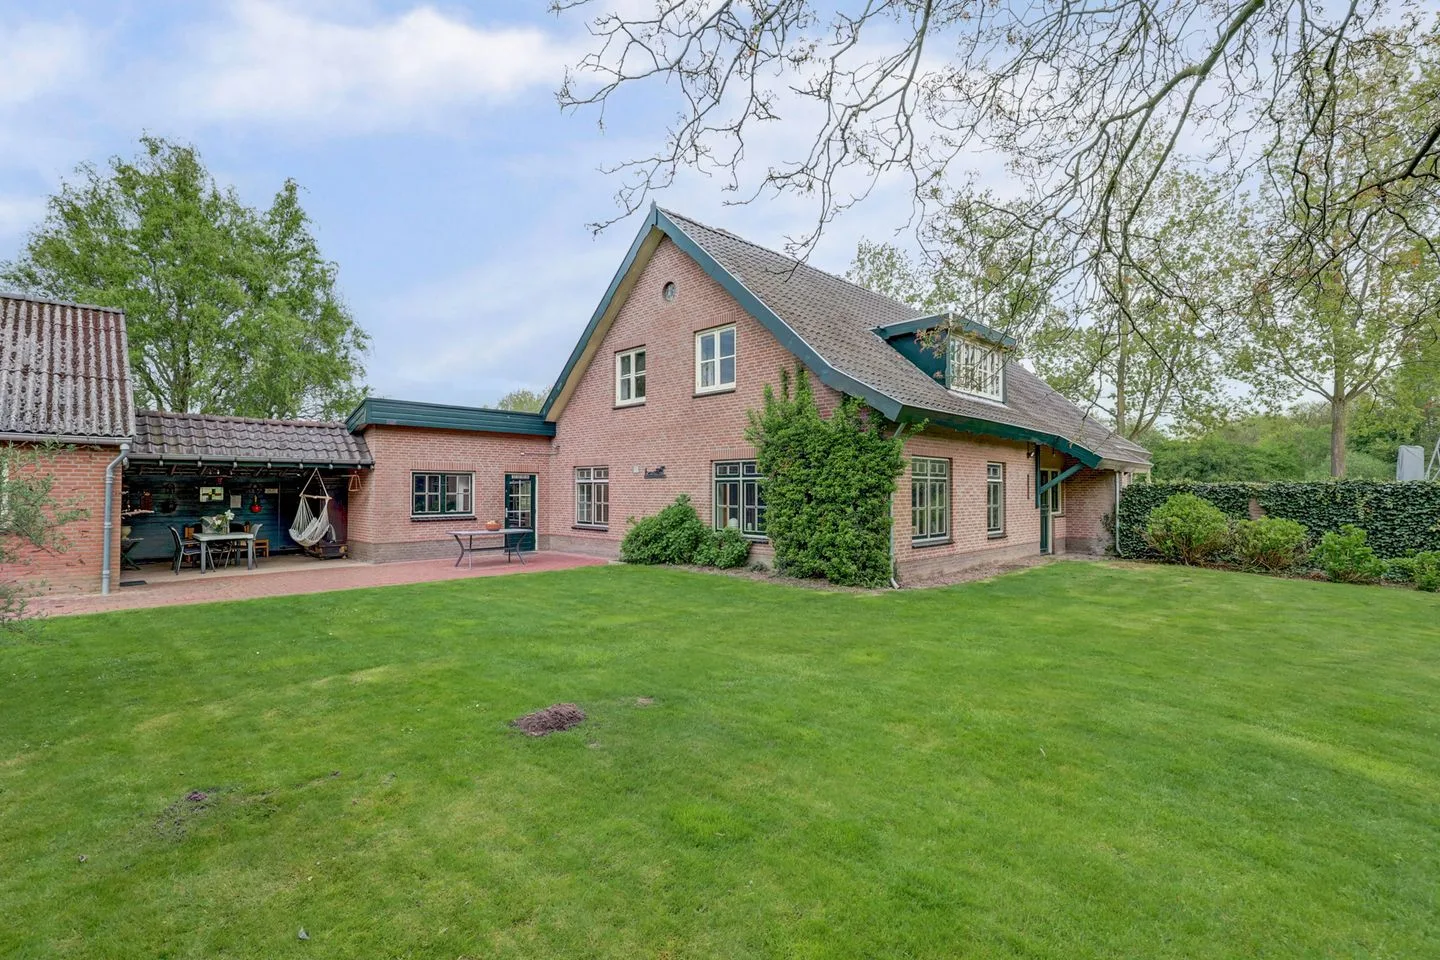
Jonkerstraat 48
6551DK Weurt
€ 850.000 k.k.
€ 3.484/m²
ESave as favorite- Living area
- 244 m²
- Land area
- 5850 m²
- Bedrooms
- 6
-
- Available
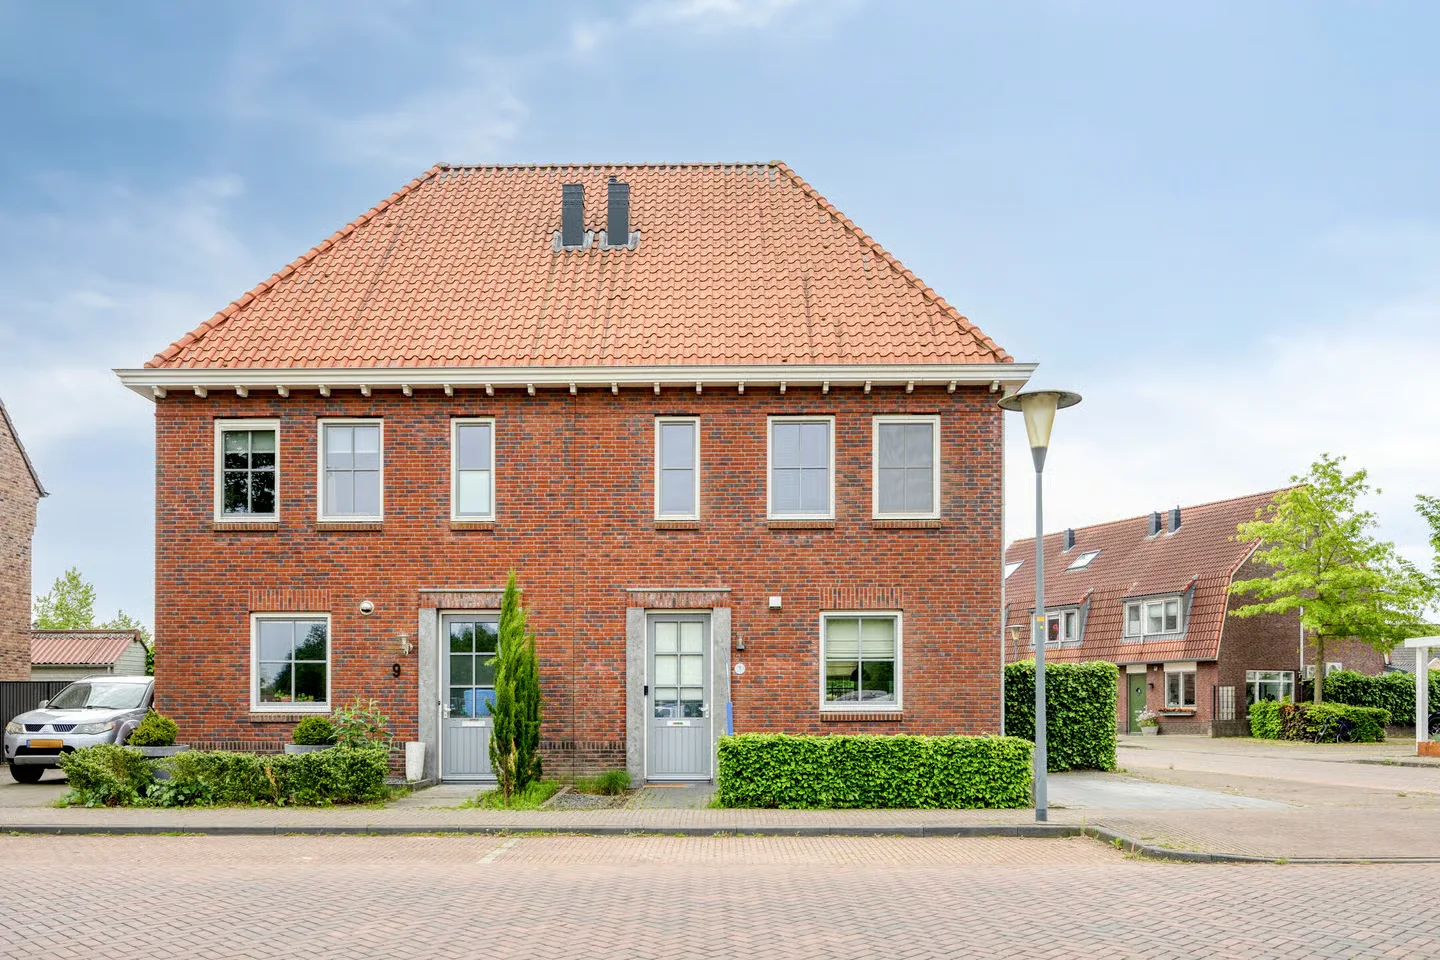
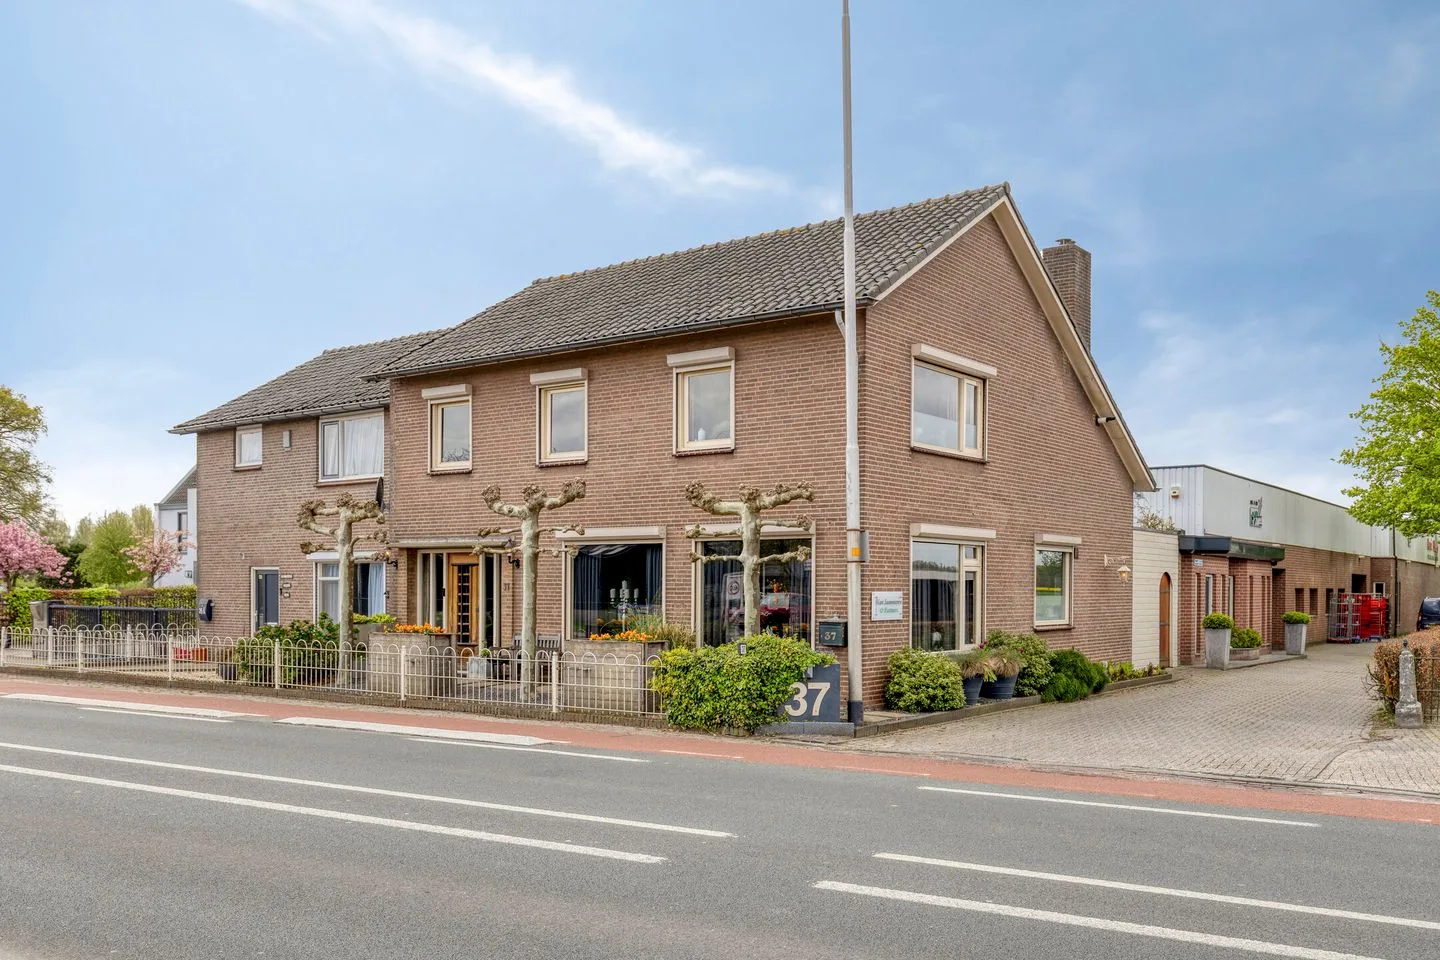
Graafseweg 37
6603CA Wijchen
€ 450.000 k.k.
€ 2.296/m²
DSave as favorite- Living area
- 196 m²
- Land area
- 210 m²
- Bedrooms
- 5
-
- Available
Hillekensacker 3075
6546LK Nijmegen
€ 750.000 k.k.
€ 5.172/m²
A+++Save as favorite- Living area
- 145 m²
- Land area
- 507 m²
- Bedrooms
- 4
Reviews (66)
Review platforms
BronscoresTotal score
66 total reviews

Funda
45 reviews on Funda

21 reviews on Google
-
Saltshof 2808
10Mike van HW makelaardij heeft ons top geholpen, geadviseerd en begeleid in de aankoop van onze nieuwe woning. Hij is laagdrempelig bereikbaar en eerlijk in communicatie.
-
Watersnipstraat 86
9Wij zijn ontzettend prettig geholpen en begeleid door Mike van HW Makelaardij. Hij heeft met ons door de woning gelopen, kritisch gekeken naar aandachtspuntjes en waar nodig advies gegeven. Ook op het gebied van biedingen, wat in deze tijd best wel lastig is, ook passend advies gegeven. Al met al zijn wij zeer tevreden!
-
Portugalhof 3
9Translated by AIHe had a personal guidance. Friendly, correct. You could always come for questions. Everything went smoothly. The final selling price became what was expected. This real estate agent is certainly worth recommending.
-
Saltshof 3252
9Translated by AIFine, thinking real estate agent. Knowledge of the local housing market in terms of prices, Switches quickly and is always reachable.
-
Leemweg 131
9Translated by AIFriendly, correct and good consultation! Some remarks from the seller not included in the documentation/appointment. Tip: real estate agent can record conversation(s) with seller!
-
L Gr
10 -
Ooievaarshorst 6
10Translated by AIA really nice real estate agent, always helpful if you have questions or need help with something. For the seller, it's just a real top professional.
-
Schaijksestraat 13
10Translated by AIMike combines professionalism with a personal, informal touch. Always clear, involved and with a smile. Our house was sold well thanks to him and the whole process went very smoothly.
-
Bas van den Hoogen
10Translated by AIAn accessible and pleasant real estate agent with an eye for the client; the customer-friendliness and involvement made the journey very pleasant.
-
Dokter Kanterslaan 177
10Translated by AIIn 2019 I sold my house in Wijchen successfully within 2 weeks. When my mother wanted to put her house in Grave up for sale, the choice of this real estate agent was therefore quickly made. Henk & Mike are absolute top performers from start to finish! I recommend everyone in this region to choose HW Real Estate Agents. You will absolutely have no regrets. My mother's house is now also sold and handed over to the new residents!
-
Marskramer 117
10Translated by AIThey have knowledge of the subject and Mike thinks with you. If you have any questions, you can always reach him/consult him.
-
Marssingel 10
10Translated by AIPleasant and warm cooperation. Good feedback and expert advice that we could relate to. Good knowledge of the market and good information. No fluff but clear and understandable advice. Would definitely recommend this real estate agent to others.
-
de Flier 3829
7Translated by AIFine, sometimes we still had to follow up on a number of issues. That wasn't so pleasant. As a result, we found the follow-up of matters to be rather mediocre.
-
Blauwe Hof 4307
9Translated by AIPreparation and initial contact were excellent and well-prepared. Sales/market information was ample and detailed. It was good for us to form an opinion and ultimately make decisions. We could always turn to someone with questions. Information about the timeline, sales process was also good. Every sales path is different; the `one size fits all´ information after sales wasn't always clear to us but our questions were answered neatly on time.
-
Estersveldlaan 78
10Translated by AIFrom the beginning, everything went smoothly and we were kept well informed about everything. Top company.
-
Wintertaling 20
10Translated by AIVery nice realtor! Thinks along with a good strategy when bidding. Good communication with realtor Mike Eichelsheim. Definitely recommended!
-
Eliasstraat 9
9Translated by AIgood contact, expert, friendly, good price-quality ratio, helpful, on time for appointments
-
Zwanenveld 3305
9Translated by AIGood contact, friendly and knowledgeable. Also present at the transfer with the notary, gives a feeling of trust. We recommend this real estate agent.
-
Aalsburg 2402
9Translated by AIEngaged and very well known locally. Particularly professionally and yet also very personally guided both during this sale and the replacement purchase. I almost never give a score of 10, so 9 is superb and the highest achievable!
-
Oosterweg 67
10Translated by AIClear communication and agreements were kept. We experienced the entire guidance as very pleasant.