Residents
162.473
Last year: 2026
6546GE Nijmegen • Gelderland
€ 365.000 k.k.
Cost of copper (estimated): € 9.150
2% transfer tax (€ 7.300) + notary (€ 1.150) + valuation (€ 700)
Total incl. VAT: € 374.150
Purchase price /m²: € 4.398
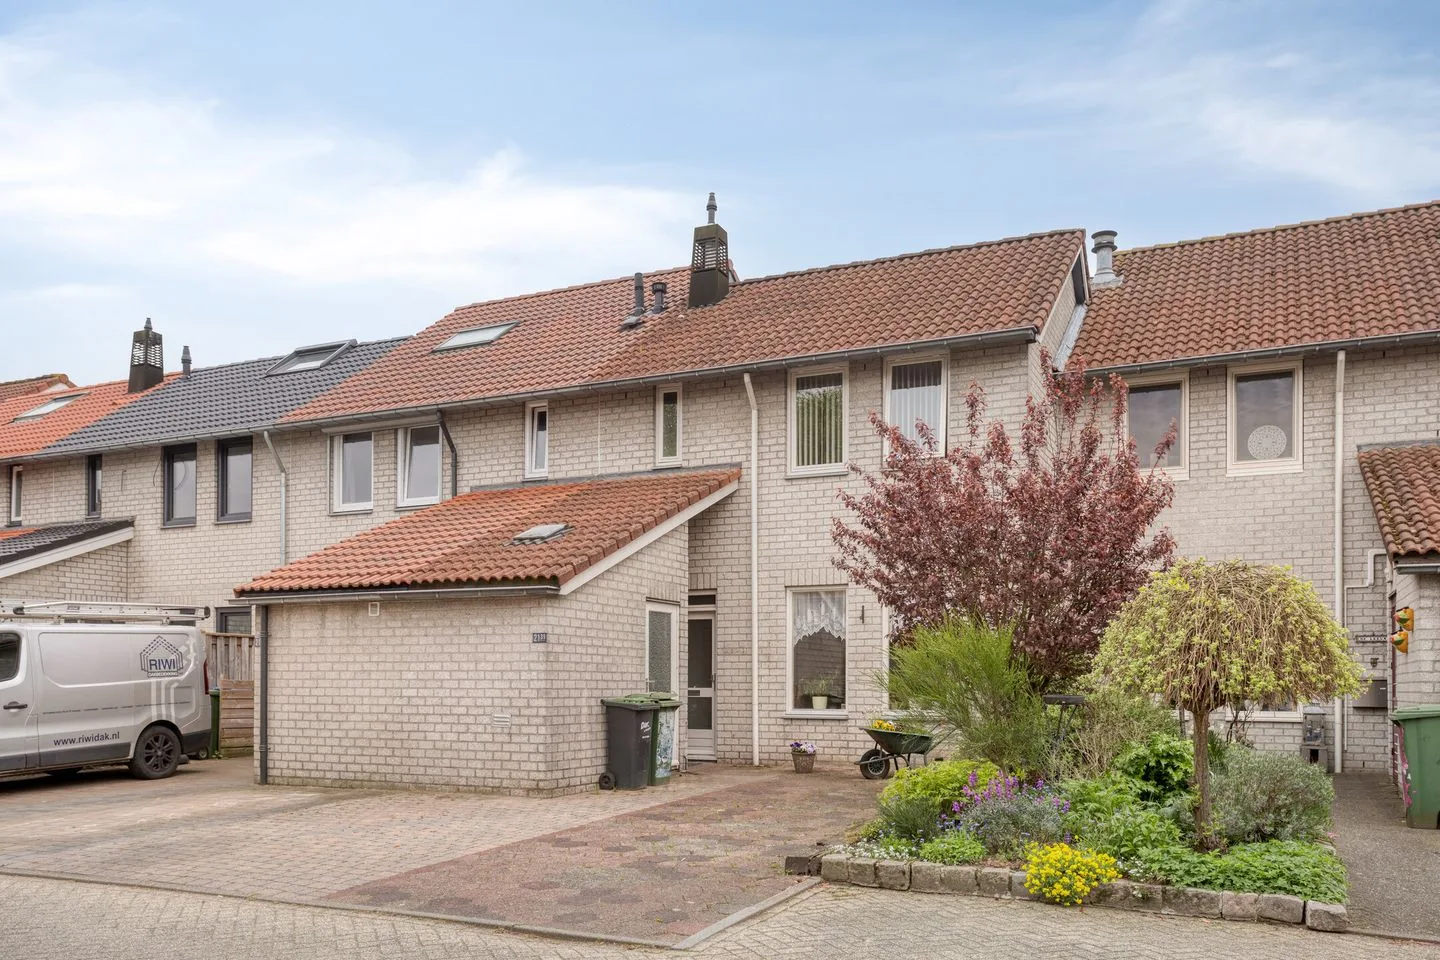
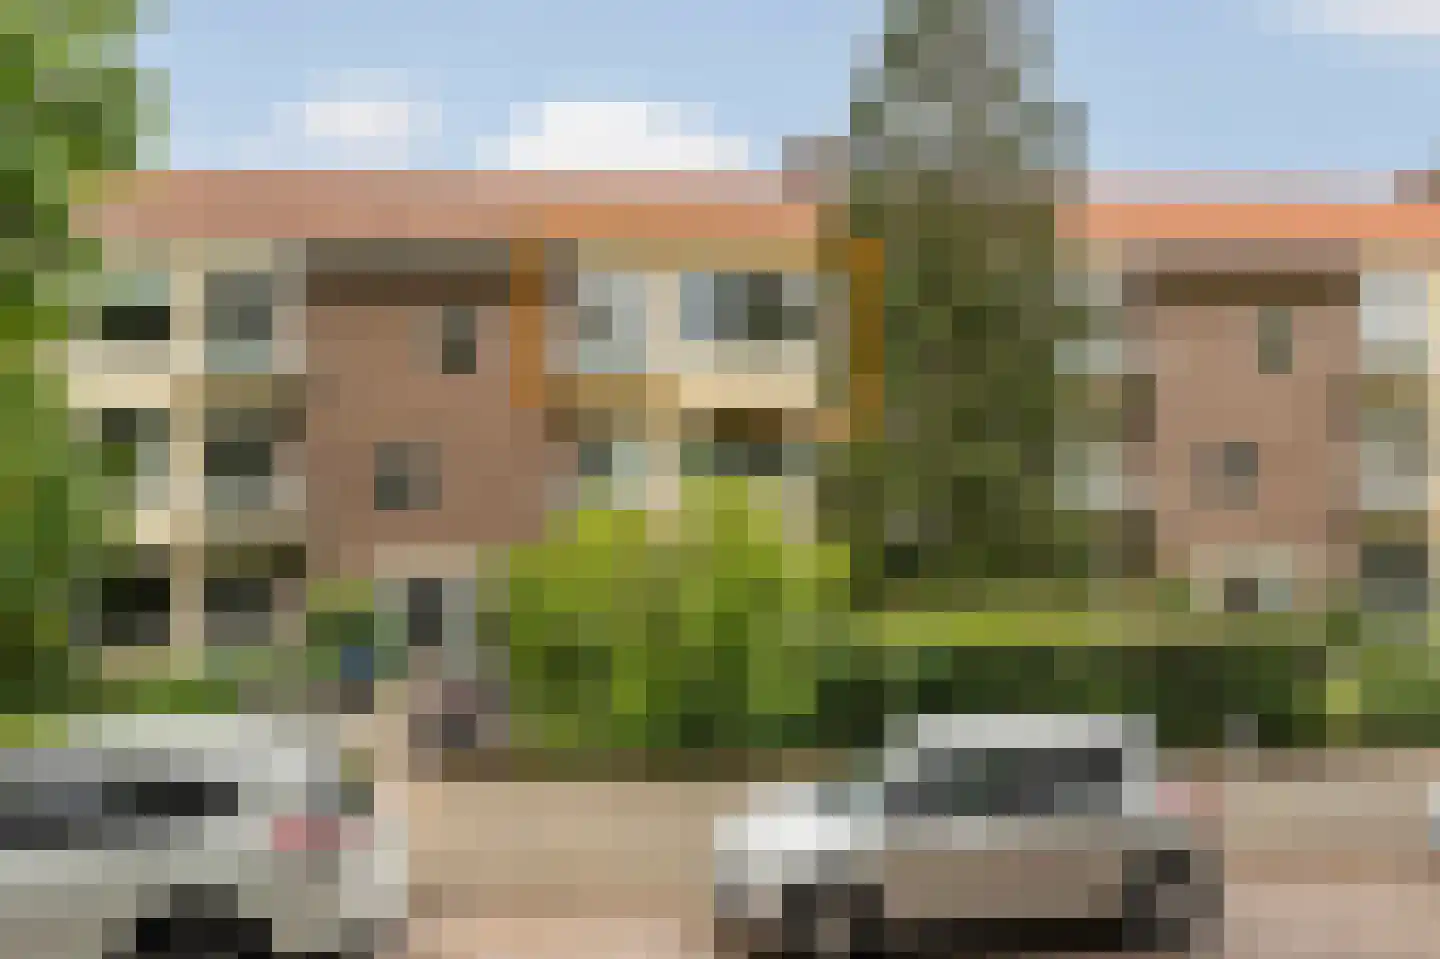
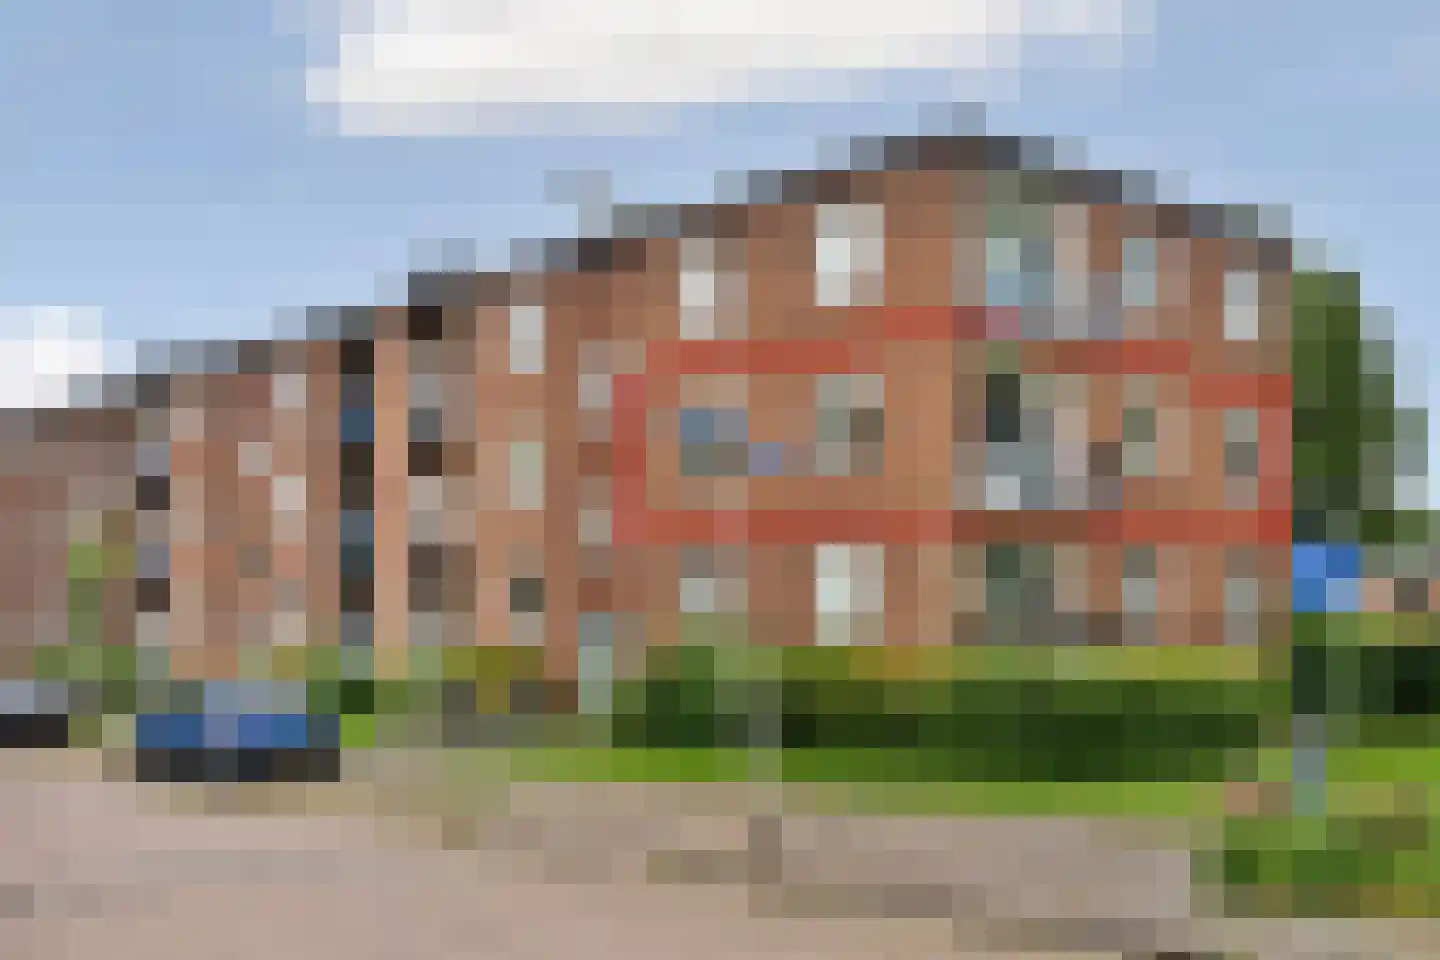
In deze ruim opgezette woonomgeving, op loopafstand van royaal openbaar groen en water, ligt deze eengezinswoning. Het betreft een tussenwoning op een royaal perceel van 235 m² met diepe zonnige tuin grenzend aan water en met een houten tuinberging aan de achterzijde én aan de voorzijde een aangebouwde (fietsen)berging en bestraatte voortuin met plaats voor 2 auto’s op eigen terrein. Het straatbeeld is levendig door de verspringende voorgevel en de verschillende nokhoogtes van de daken. Met maar liefst 4 slaapkamers is het een echte gezinswoning maar het combineren van wonen en thuiswerken kan hier ook prima. De woning biedt zowel op de begane grond alsmede op de tweede verdieping tal van uitbreidingsmogelijkheden waardoor het woonoppervlak flink kan worden vergroot. In de wijk zijn tal van voorbeelden van wat er kan en mag. Het totaal inpandig oppervlak exclusief de aangebouwde berging is 95 m²; hiervan is 12 m² overige inpandige ruimte op de zolderetage. De woning is gedateerd qua voorzieningen en afwerking maar zeker nog functioneel. Het perfecte vertrekpunt voor diegenen die eigen wensen en smaak willen toevoegen aan een al bestaande woning. Het energielabel B is een mooi begin en met het plaatsen van enkele zonnepanelen maak je er al gemakkelijk een label A van en dat is interessant voor de financieringsmogelijkheden. Een fijne woning is één, maar de woonomgeving is natuurlijk net zo belangrijk. De situering van de woning aan de rand van de wijk is zeer rustig te noemen; kindvriendelijk dus. De straten zijn ruim en naast je eigen parkeerplaats(en) is er voldoende parkeergelegenheid voor je bezoek. Op een steenworp afstand tref je een park aan waar je lekker in alle rust en in het groen kunt wandelen. Kinderboerderij Lindenholt en waterplas De Ontmoeting is op die manier lopend te bereiken. De ligging is centraal en winkelcentrum Dukenburg en de Woonboulevard zijn lopend bereikbaar. Het grote winkelcentrum herbergt niet alleen alle bekende landelijke ketens maar er zijn ook diverse (openbare) voorzieningen zoals een bibliotheek en apotheek. Openbaar vervoer is goed geregeld met zowel een trein- als busstation op korte afstand. En met de auto heb je direct aansluiting op het landelijk wegennet (A73 en A50). Het snelfietspad naar het centrum en de campus van de universiteit is ook nabij. In de wijk zelf en het nabijgelegen Leuvensbroek zijn buurtwinkelcentra met supermarkten etc. Basisscholen en middelbare scholen zijn allen vertegenwoordigd in de omgeving. Indeling: Begane grond: overdekte entree; hal met meterkast, garderobe, trapkast en toilet voorzien een fonteintje. Lichte doorzon woonkamer met deur naar terras. De halfopen keuken met eenvoudige hoekopstelling is voorzien van een ingebouwde inductiekookplaat en afzuigkap. Ook een separate onderbouw vaatwasser is onderdeel van de keuken. Eerste verdieping: overloop met toegang tot de drie slaapkamers. De slaapkamers aan de achterzijde hebben via een dakraam zicht op de achtertuin. De badkamer is net als de keuken eenvoudig maar functioneel en beschikt over een douche, wastafelmeubel en tweede toilet. Tweede verdieping: voorzolder met opstelling cv-ketel en dakraam; zolderkamer met dakkapel. Voorts diverse bergruimte. Bijzonderheden: - Centrale verwarming via Intergas combiketel uit 2014 (het betreft een huurketel). - Dak- en muurisolatie vanuit het bouwjaar en kozijnen en dakramen met dubbele beglazing. - Energielabel B. - Fijne tuin met veel privacy met terras bij achtergevel en een tweede terras aan de waterkant. - Ruim opgezette woonomgeving met louter laagbouw; kindvriendelijk en veel groen. - Centraal gelegen. Goede aansluiting met auto, fiets én openbaar vervoer. - Alle denkbare voorzieningen op korte afstand. Let op: Het huurcontract van de CV-ketel loopt tot 06-09-2026. Mogelijkheid tot overname huurcontract, anders wordt ketel volgens huurcontract opgehaald. Huurprijs is € 34,95 p.m.
€ 365.000
Cost of copper (estimated): € 9.150
2% transfer tax (€ 7.300) + notary (€ 1.150) + valuation (€ 700)
Total purchase (incl. p.p.): € 374.150
3,02%
Yearly
€ 18.250
Direct available
Estimated mortgage
Indicative gross monthly cost
Based on annuity and 30 year term
Indicative net monthly cost
iDisclaimer: this mortgage calculation is a simplified indication based on general assumptions. No rights can be derived from the results shown. Calculated with 10-annual interest (met NHG), automatically determined based on the price limit € 470.000. Source: 10-jaars rente uit mortgage_rates (08-06-2026 03:45).
Douche, toilet, en wastafelmeubel
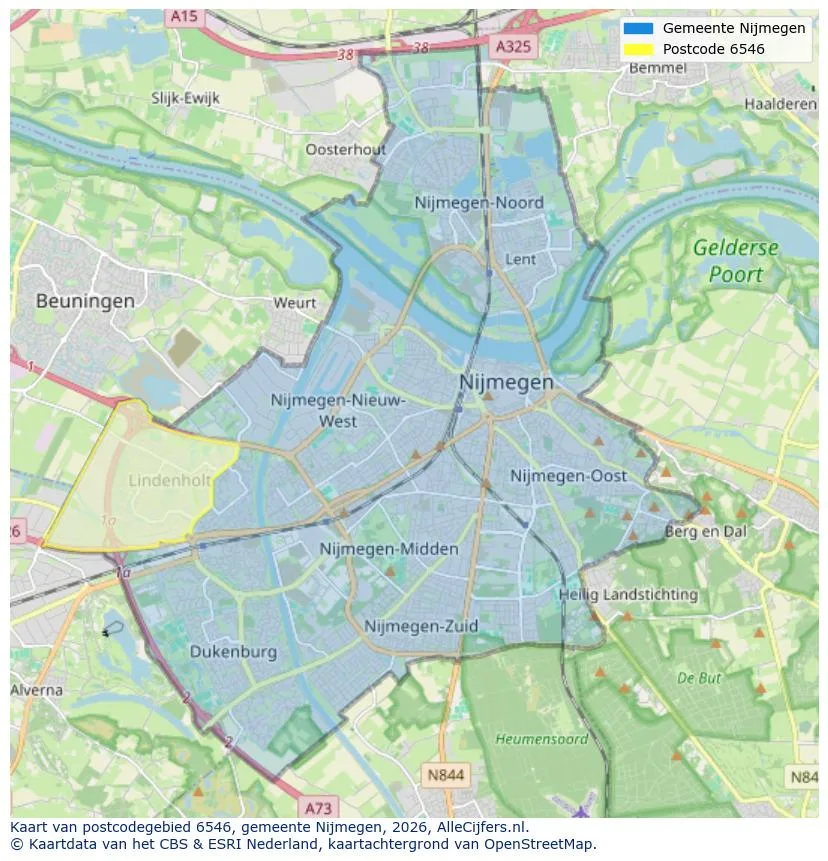
View the location and discover the brokers in this region
View current location data on residents, WOZ development, housing stock, energy consumption, business activity and safety in Nijmegen. In 2026 were there 162.473 residents. The average WOZ value in 2025 is EUR 371.314.
Residents
162.473
Last year: 2026
Average WOZ
EUR 371.314
Last year: 2025
Average income per person.
EUR 32.906
Source: AllNumbers
Crimes (current year)
11.524
Total registered
| Year | Residents |
|---|---|
| 2021 | 156.510 |
| 2022 | 156.795 |
| 2023 | 158.905 |
| 2024 | 162.215 |
| 2025 | 162.625 |
| 2026 | 162.473 |
| Year | Average WOZ |
|---|---|
| 2021 | EUR 264.961 |
| 2022 | EUR 297.658 |
| 2023 | EUR 347.878 |
| 2024 | EUR 359.818 |
| 2025 | EUR 371.314 |
Hoger
59.500
Praktisch
26.370
Middelbaar
46.030
Europa
16.780
Nederland
112.815
Buiten Europa
33.035
Label A
23.919
Label C
20.020
Label B
10.981
Label D
7.140
Label E
5.880
Label G
5.719
Label F
4.840
Label A+
2.692
Label A++
1.966
Label A+++
1.100
Label A++++
111
Label A+++++
12
| Year | Gas (m3) | Electricity (kWh) |
|---|---|---|
| 2020 | 1.053 | 2.382 |
| 2021 | 1.196 | 2.412 |
| 2022 | 956 | 2.277 |
| 2023 | 805 | 2.148 |
| 2024 | 795 | 2.181 |
Hoekwoning
Gas: 1.065 • Electricity: 2.616
Huurwoning
Gas: 717 • Electricity: 1.885
Koopwoning
Gas: 921 • Electricity: 2.495
Appartement
Gas: 628 • Electricity: 1.697
Tussenwoning
Gas: 907 • Electricity: 2.418
Vrijstaande woning
Gas: 1.708 • Electricity: 4.204
Twee-onder-één-kap woning
Gas: 1.228 • Electricity: 3.043
Total number of company establishments: 21.485
| Period | Crimes |
|---|---|
| jan 2026 | 823 |
| jul 2025 | 1.226 |
| jun 2025 | 913 |
| mei 2025 | 970 |
| mrt 2025 | 906 |
| mrt 2026 | 940 |
| nov 2024 | 973 |
| nov 2025 | 986 |
| okt 2024 | 1.015 |
| okt 2025 | 1.044 |
| sep 2024 | 825 |
| sep 2025 | 986 |
These figures give an indicative picture of safety trends in the living environment of Nijmegen.
Short answers based on current local statistics, handy for a quick comparison of the living environment.
Nijmegen telt in 2026 ongeveer 162.473 inwoners.
De gemiddelde WOZ-waarde in Nijmegen is in 2025 circa € 371.314.
Het gemiddelde inkomen per inwoner in Nijmegen ligt rond € 32.906 per jaar.
Voor het huidige jaar gaat het om ongeveer 11.524 geregistreerde misdrijven. Gebruik deze cijfers als indicatie en vergelijk trends per periode.
In Nijmegen komt vooral "Appartementen" veel voor, met ongeveer 41.653 woningen.
View more homes in this location.

6523RJ Nijmegen
€ 289.000 k.k.
€ 6.149/m²

6546KS Nijmegen
€ 275.000 k.k.
€ 6.707/m²
6512JB Nijmegen
€ 395.000 k.k.
€ 4.817/m²

6541AS Nijmegen
€ 355.000 k.k.
€ 7.889/m²
6541AS Nijmegen
€ 275.000 k.k.
€ 8.333/m²

6523GR Nijmegen
€ 430 p/m
€ 33/m²
6524NK Nijmegen
€ 375.000 k.k.
€ 4.573/m²
6543XR Nijmegen
€ 329.000 k.k.
€ 4.634/m²
