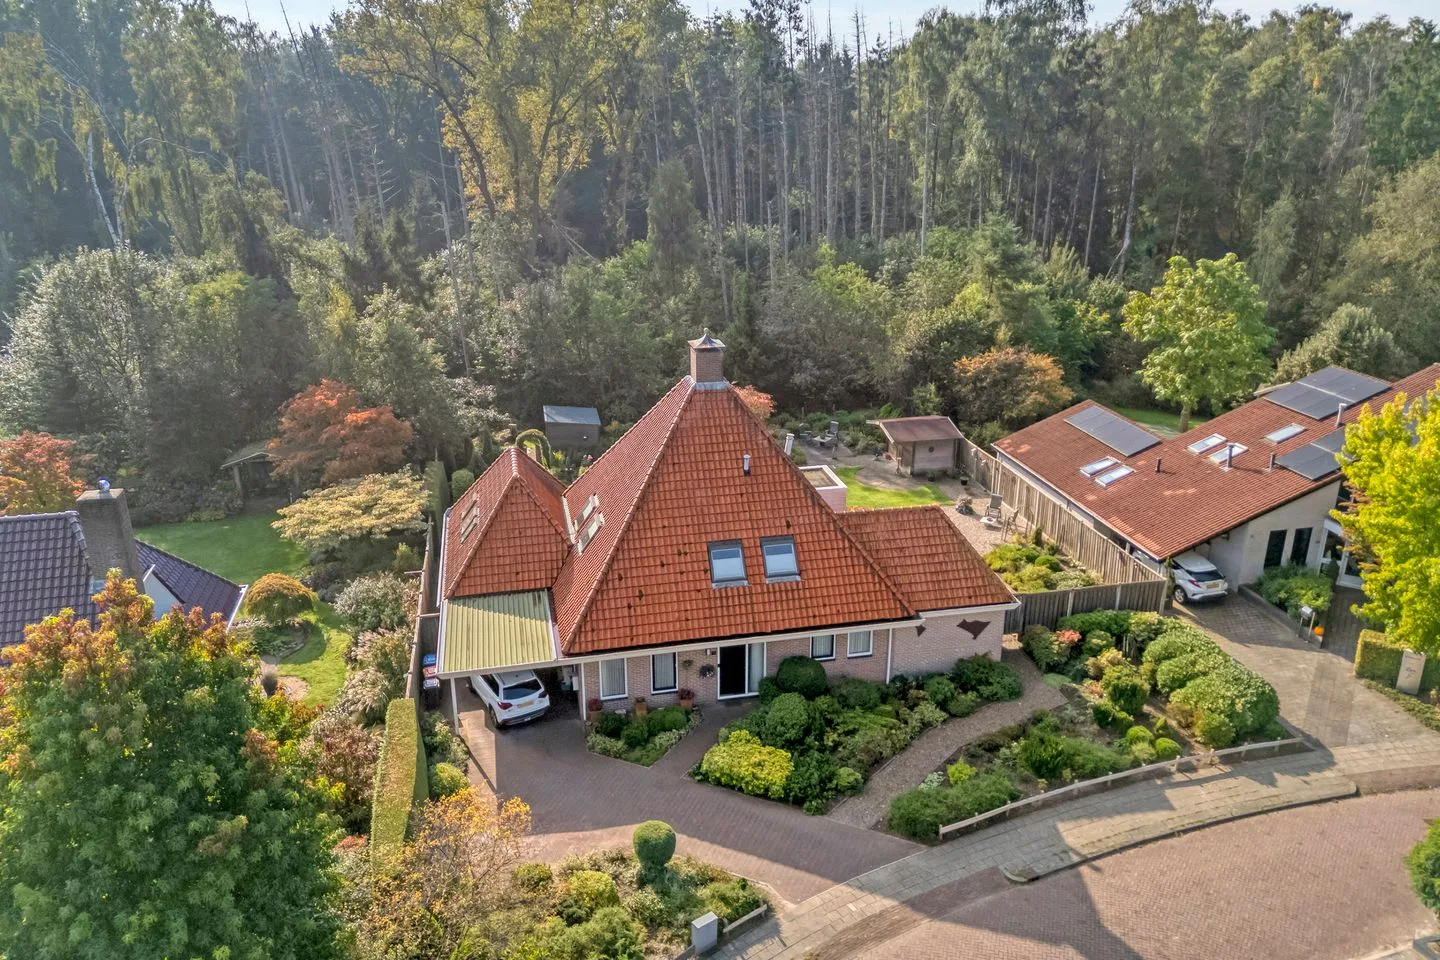
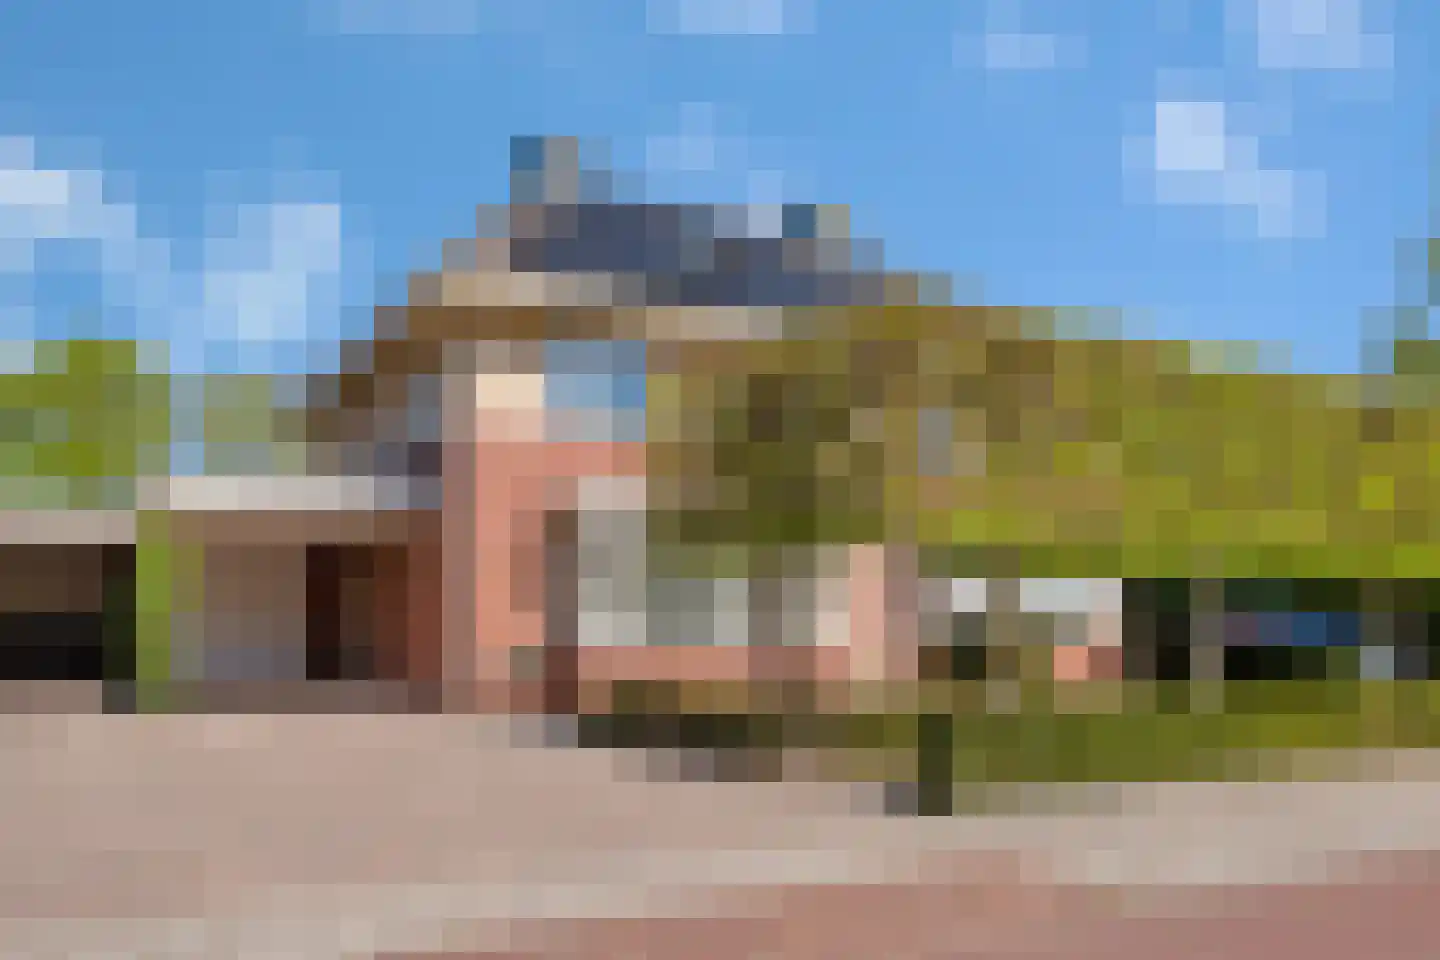
- Available
Keizerserf 46
7442MN Nijverdal
€ 525.000 k.k.
€ 3.889/m²
- Living area
- 135 m²
- Land area
- —
- Bedrooms
- 2
Searching in 310 houses in Nijverdal
Type to search. Use arrow down and arrow up to navigate through results and press Enter to open.
Hidden search suggestions.
View current properties in Nijverdal or search targeted on street, postal code and property characteristics.
View the current housing stock in Nijverdal and quickly filter by price, living area, rooms and more. There are currently 310 houses in this place within our selection. View also 218 sold houses in Nijverdal for extra insight into the local housing market.
7442MN Nijverdal
€ 525.000 k.k.
€ 3.889/m²
7441EM Nijverdal
€ 385.000 k.k.
€ 4.278/m²
7443BS Nijverdal
€ 529.000
€ 5.813/m²
7443BR Nijverdal
€ 499.000
€ 5.424/m²
7441PD Nijverdal
€ 1.100.000 k.k.
€ 5.556/m²
7442MG Nijverdal
€ 565.000
€ 5.539/m²
7441JC Nijverdal
€ 1.065.000 k.k.
€ 4.776/m²
7442CN Nijverdal
€ 825.000 k.k.
€ 3.650/m²
7443BR Nijverdal
€ 750.000 k.k.
€ 5.396/m²
7442MC Nijverdal
€ 315.000 k.k.
€ 2.283/m²
7442MG Nijverdal
€ 565.000
€ 5.539/m²
7442MG Nijverdal
€ 595.000
€ 5.409/m²
7441HZ Nijverdal
€ 1.890.000 k.k.
€ 3.728/m²
7443LH Nijverdal
€ 549.000 k.k.
€ 3.119/m²
7441DM Nijverdal
€ 389.500 k.k.
€ 3.167/m²
7441EH Nijverdal
€ 295.000 k.k.
7441AA Nijverdal
€ 300.000 k.k.
7443LN Nijverdal
€ 325.000 k.k.
7441DS Nijverdal
€ 475.000 k.k.
7442AZ Nijverdal
€ 489.000 k.k.
€ 3.349/m²
7442JX Nijverdal
€ 395.000 k.k.
€ 3.292/m²
7443JN Nijverdal
€ 400.000 k.k.
€ 3.636/m²
7443TC Nijverdal
€ 539.000 k.k.
€ 3.477/m²
7442HE Nijverdal
€ 400.000 k.k.
€ 3.333/m²
7442AZ Nijverdal
€ 449.500 k.k.
€ 5.167/m²
7442EK Nijverdal
€ 425.000 k.k.
€ 3.972/m²
7443TN Nijverdal
€ 500.000 k.k.
€ 3.205/m²
7441GL Nijverdal
€ 525.000 k.k.
€ 5.048/m²
Get free quotes from real estate agents with local market knowledge. Compare more than 19 real estate agents in Nijverdal.
Selling a home in Nijverdal? View the sales-oriented guide sell a house in Nijverdal, compare all real estate agents in Nijverdal or view the top 10 real estate agents in Nijverdal for extra context to your choice.
Real estate agents make sharper offers when they know you're comparing — ask for quotes for sale or purchase.
Practical answers about housing supply, sales and comparing real estate agents in Nijverdal.
The costs of a real estate agent in Nijverdal depend on commission, setup costs, property presentation and the chosen service. Compare the 19 real estate agents in Nijverdal via the real estate agent page and request multiple quotes to compare rates and approach well.
Within our selection, we are currently showing 310 houses in Nijverdal. View also the sold houses in Nijverdal to compare the current offering with recent transactions.
Take into account not only price and living area but also maintenance, energy label, location, outdoor space and sales status. This way you compare houses in Nijverdal on more than just the asking price.
A local real estate agent knows the neighborhoods, recent transactions and demand in Nijverdal. By comparing 19 real estate agents in the region you get a better insight into prices, sales strategy and expected yield; the top 10 in Nijverdal provides a useful starting point.
Yes, when making a sales plan, a valuation in Nijverdal is wise. You gain insight into a realistic asking price and can then compare offers from real estate agents specifically.
View current location data on residents, WOZ development, housing stock, energy consumption, business activity and safety in Nijverdal. In 2026 were there 23.681 residents. The average WOZ value in 2025 is EUR 365.934.
These figures help to better assess and compare the housing stock in Nijverdal with recent sold homes. Orient yourself then on suitable top real estate agents in Nijverdal for sales advice in this region.
Residents
23.681
Last year: 2026
Average WOZ
EUR 365.934
Last year: 2025
Average income per person.
EUR 28.592
Source: AllNumbers
Crimes (current year)
733
Total registered
| Year | Residents |
|---|---|
| 2021 | 23.690 |
| 2022 | 23.635 |
| 2023 | 23.770 |
| 2024 | 23.770 |
| 2025 | 23.695 |
| 2026 | 23.681 |
| Year | Average WOZ |
|---|---|
| 2021 | EUR 261.139 |
| 2022 | EUR 298.206 |
| 2023 | EUR 332.074 |
| 2024 | EUR 360.487 |
| 2025 | EUR 365.934 |
Hoger
4.500
Praktisch
4.420
Middelbaar
8.620
Europa
755
Nederland
21.250
Buiten Europa
1.685
Label C
2.928
Label A
2.399
Label B
2.384
Label G
824
Label D
805
Label F
726
Label E
371
Label A++
184
Label A+
169
Label A+++
103
Label A++++
97
Label A+++++
8
| Year | Gas (m3) | Electricity (kWh) |
|---|---|---|
| 2020 | 1.271 | 2.924 |
| 2021 | 1.427 | 2.954 |
| 2022 | 1.115 | 2.764 |
| 2023 | 932 | 2.651 |
| 2024 | 901 | 2.748 |
Hoekwoning
Gas: 955 • Electricity: 2.700
Huurwoning
Gas: 707 • Electricity: 1.969
Koopwoning
Gas: 1.025 • Electricity: 2.925
Appartement
Gas: 584 • Electricity: 1.709
Tussenwoning
Gas: 853 • Electricity: 2.419
Vrijstaande woning
Gas: 1.267 • Electricity: 3.680
Twee-onder-één-kap woning
Gas: 1.030 • Electricity: 2.863
Total number of company establishments: 2.240
| Period | Crimes |
|---|---|
| jan 2026 | 68 |
| jul 2025 | 47 |
| jun 2025 | 59 |
| mei 2025 | 45 |
| mrt 2025 | 68 |
| mrt 2026 | 63 |
| nov 2024 | 67 |
| nov 2025 | 83 |
| okt 2024 | 61 |
| okt 2025 | 82 |
| sep 2024 | 53 |
| sep 2025 | 69 |
These figures give an indicative picture of safety trends in the living environment of Nijverdal.
Short answers based on current local statistics, handy for a quick comparison of the living environment.
Nijverdal telt in 2026 ongeveer 23.681 inwoners.
De gemiddelde WOZ-waarde in Nijverdal is in 2025 circa € 365.934.
Het gemiddelde inkomen per inwoner in Nijverdal ligt rond € 28.592 per jaar.
Voor het huidige jaar gaat het om ongeveer 733 geregistreerde misdrijven. Gebruik deze cijfers als indicatie en vergelijk trends per periode.
In Nijverdal komt vooral "Tussenwoningen" veel voor, met ongeveer 2.892 woningen.