- Available
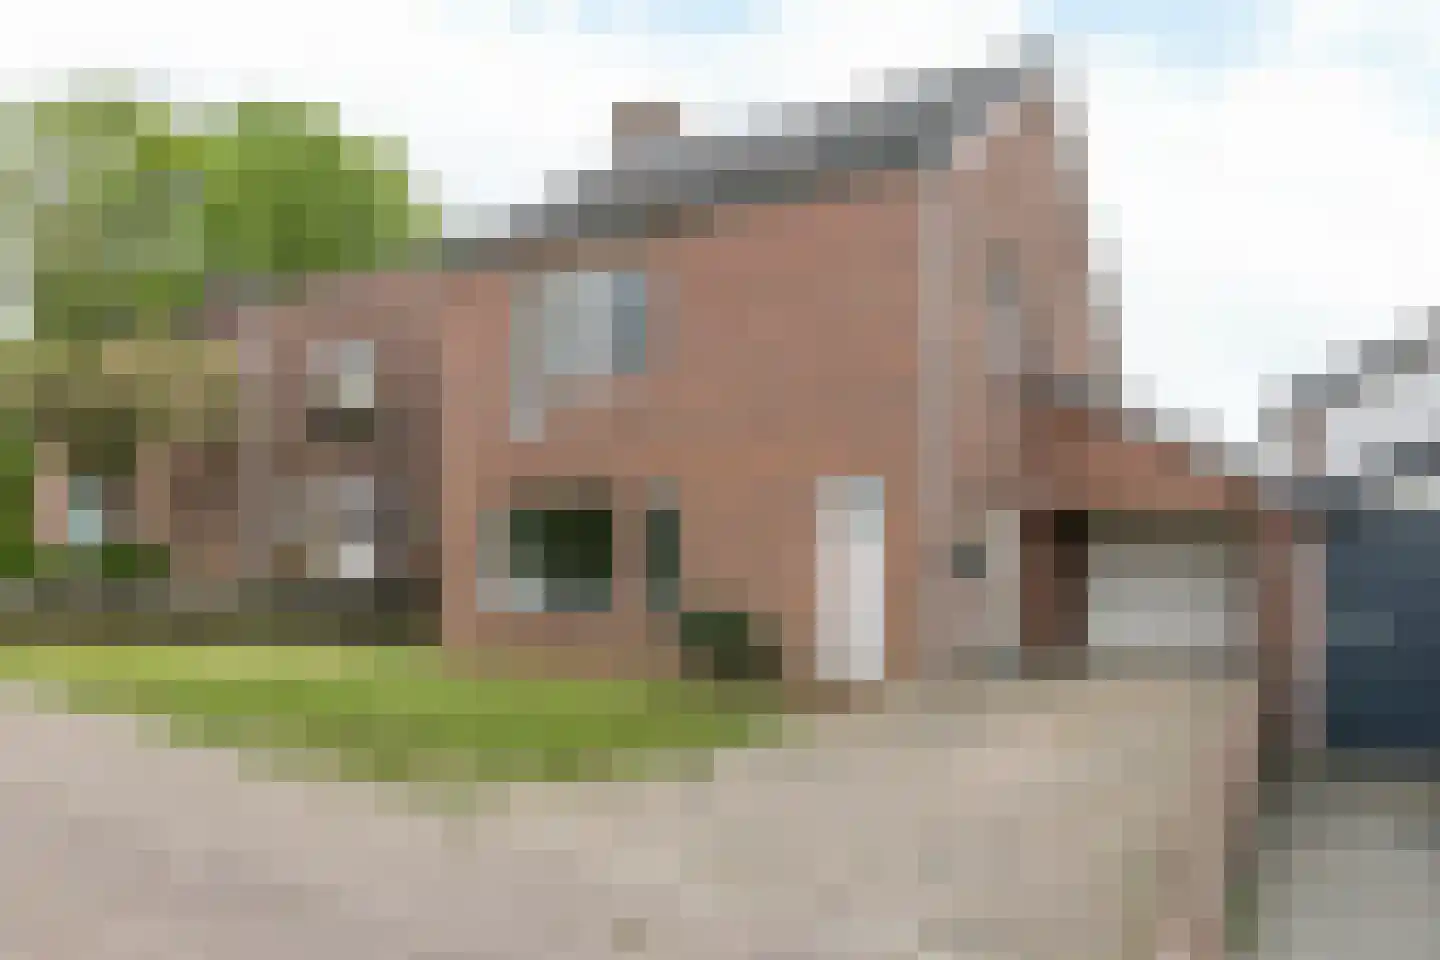
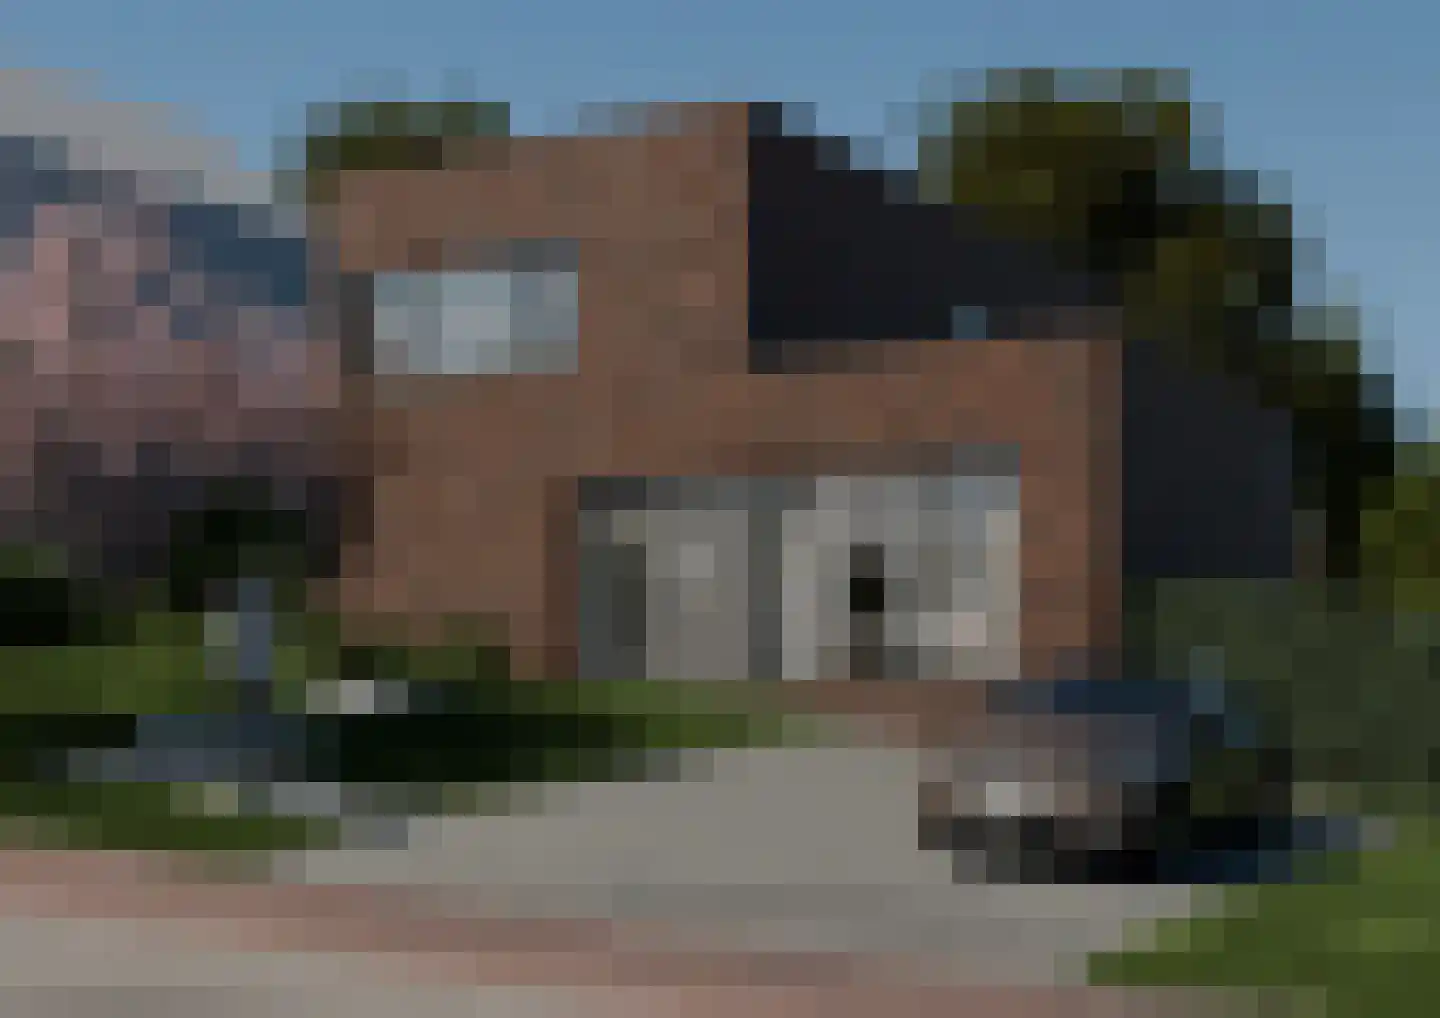
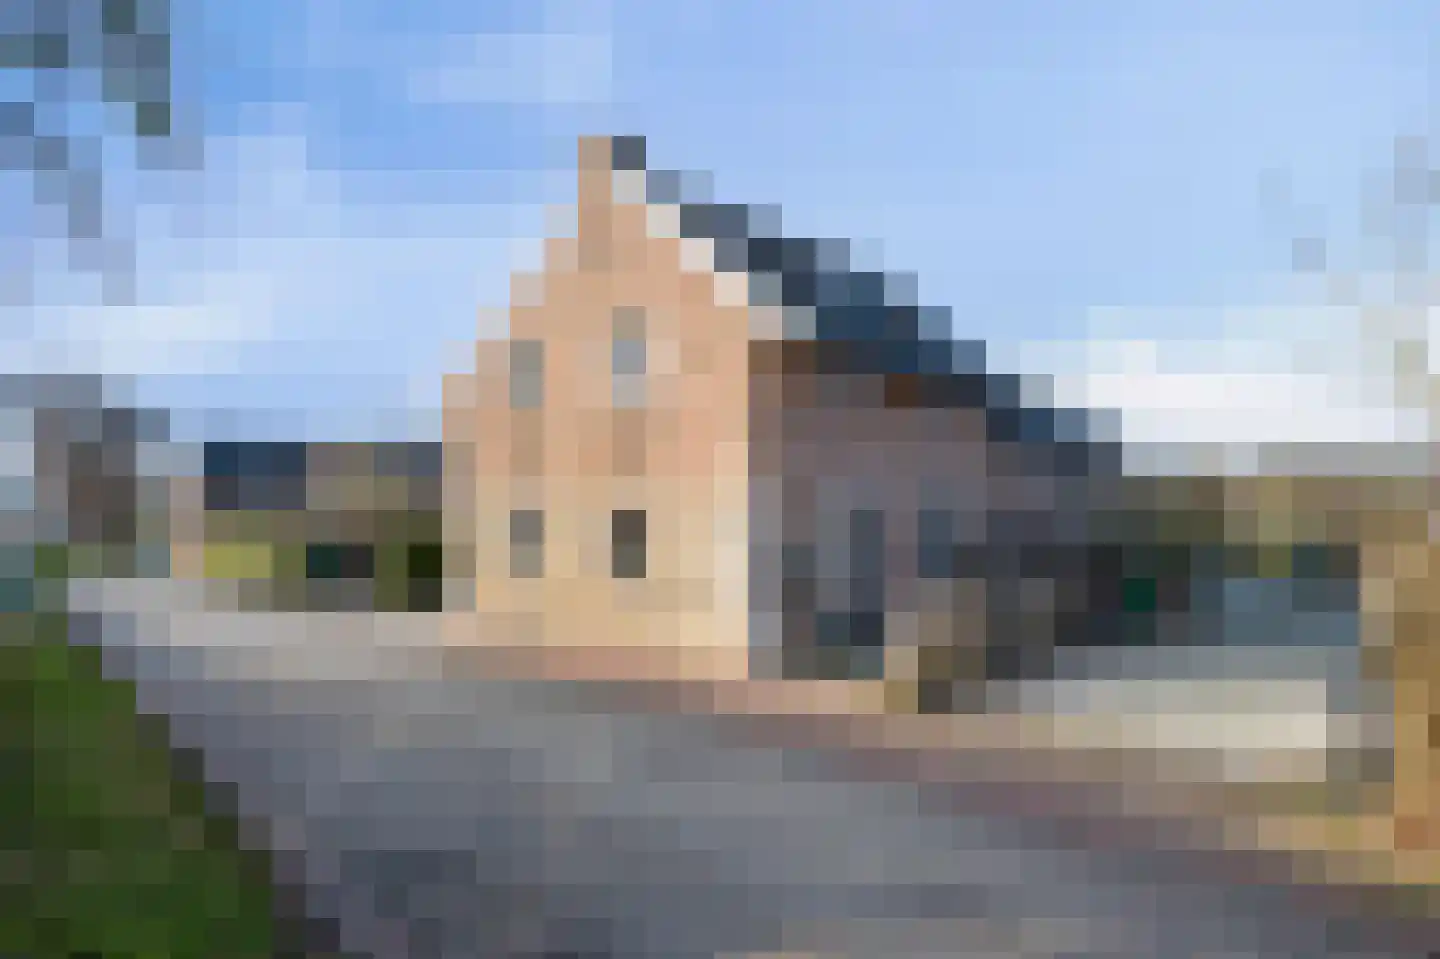
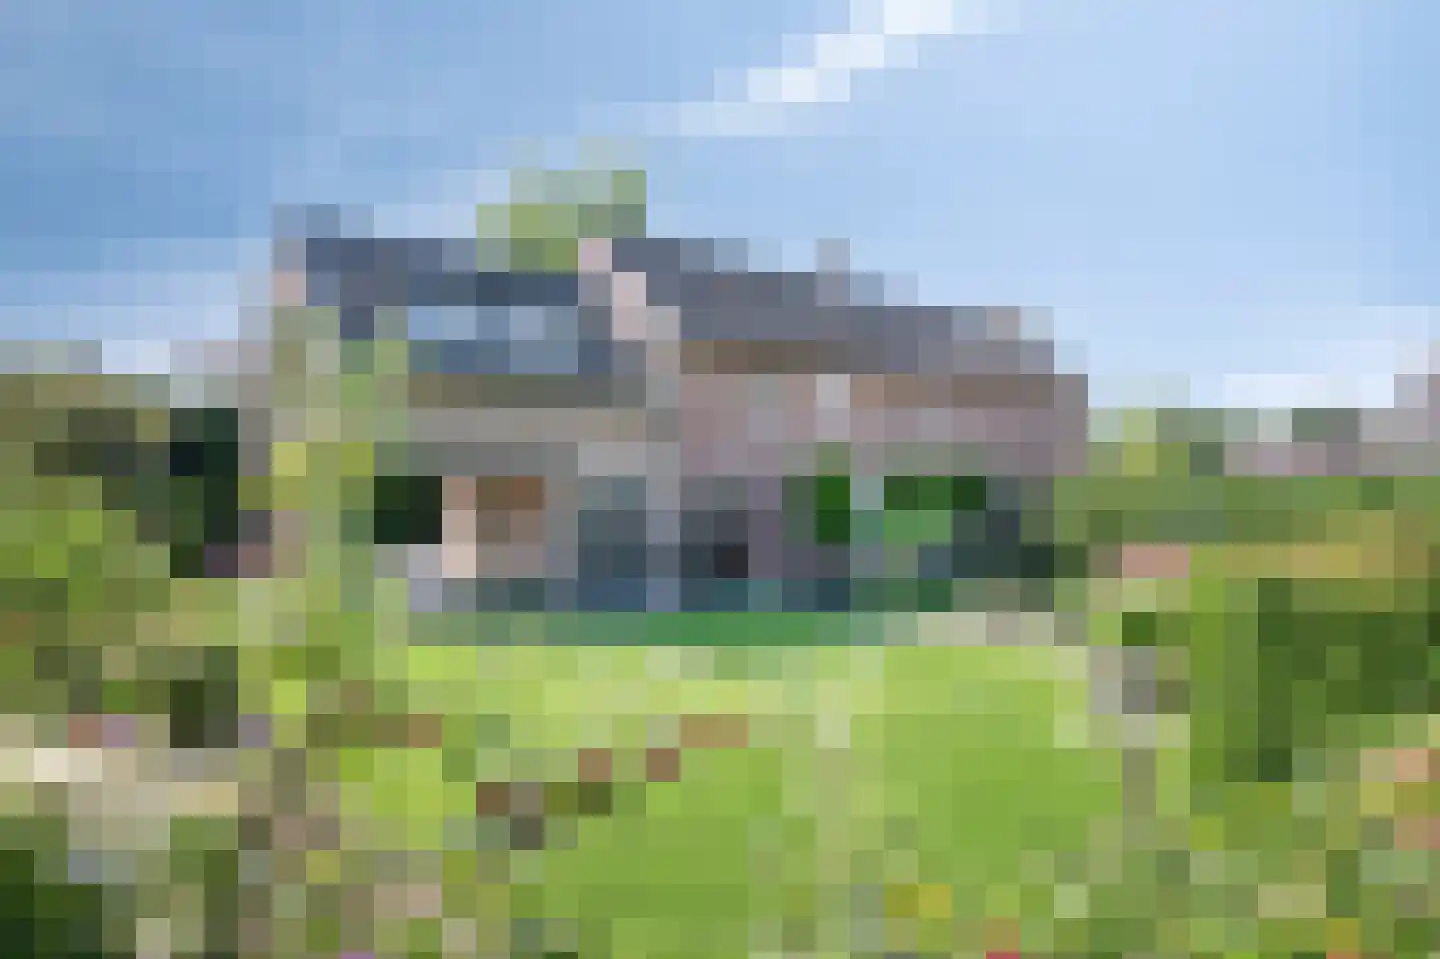
Adrianus van Duynstraat 10
6255BB Noorbeek
€ 428.000 k.k.
- Living area
- 154 m²
- Land area
- 252 m²
- Bedrooms
- 3
Searching in 13 houses in Noorbeek
Type to search. Use arrow down and arrow up to navigate through results and press Enter to open.
Hidden search suggestions.
View current properties in Noorbeek or search targeted on street, postal code and property characteristics.
View the current housing stock in Noorbeek and quickly filter by price, living area, rooms and more. There are currently 13 houses in this place within our selection. View also 9 sold houses in Noorbeek for extra insight into the local housing market.
6255BB Noorbeek
€ 428.000 k.k.
6255AX Noorbeek
€ 445.000 k.k.
6255BA Noorbeek
€ 875.000
€ 5.912/m²
6255NS Noorbeek
€ 340.000 k.k.
€ 4.487/m²
6255NL Noorbeek
€ 280.000 k.k.
€ 3.218/m²
6255AL Noorbeek
€ 495.000 k.k.
€ 4.459/m²
6255BA Noorbeek
€ 750.000 k.k.
€ 5.281/m²
6255NS Noorbeek
€ 439.000 k.k.
€ 2.582/m²
6255NS Noorbeek
€ 319.000 k.k.
€ 3.987/m²
6255AL Noorbeek
€ 345.000 k.k.
€ 4.423/m²
6255AV Noorbeek
€ 485.000 k.k.
€ 2.174/m²
6255AV Noorbeek
€ 389.000 k.k.
€ 3.890/m²
6255AM Noorbeek
€ 415.000 k.k.
€ 3.167/m²
Get free quotes from real estate agents with local market knowledge. Compare more than 20 real estate agents in Noorbeek.
Selling a home in Noorbeek? Compare all real estate agents in Noorbeek or view the top 10 real estate agents in Noorbeek for extra context for your choice.
Real estate agents make sharper offers when they know you're comparing — ask for quotes for sale or purchase.
Practical answers about housing supply, sales and comparing real estate agents in Noorbeek.
The costs of a real estate agent in Noorbeek depend on commission, setup costs, property presentation and the chosen service. Compare the 20 real estate agents in Noorbeek via the real estate agent page and request multiple quotes to compare rates and approach well.
Within our selection, we are currently showing 13 houses in Noorbeek. View also the sold houses in Noorbeek to compare the current offering with recent transactions.
Take into account not only price and living area but also maintenance, energy label, location, outdoor space and sales status. This way you compare houses in Noorbeek on more than just the asking price.
A local real estate agent knows the neighborhoods, recent transactions and demand in Noorbeek. By comparing 20 real estate agents in the region you get a better insight into prices, sales strategy and expected yield; the top 10 in Noorbeek provides a useful starting point.
Yes, when making a sales plan, a valuation in Noorbeek is wise. You gain insight into a realistic asking price and can then compare offers from real estate agents specifically.
View current location data on residents, WOZ development, housing stock, energy consumption, business activity and safety in Noorbeek. In 2026 were there 1.165 residents. The average WOZ value in 2025 is EUR 413.563.
These figures help to better assess and compare the housing stock in Noorbeek with recent sold homes. Orient yourself then on suitable top real estate agents in Noorbeek for sales advice in this region.
Residents
1.165
Last year: 2026
Average WOZ
EUR 413.563
Last year: 2025
Average income per person.
EUR 28.958
Source: AllNumbers
Crimes (current year)
22
Total registered
| Year | Residents |
|---|---|
| 2021 | 1.100 |
| 2022 | 1.105 |
| 2023 | 1.155 |
| 2024 | 1.180 |
| 2025 | 1.200 |
| 2026 | 1.165 |
| Year | Average WOZ |
|---|---|
| 2021 | EUR 304.153 |
| 2022 | EUR 320.621 |
| 2023 | EUR 376.036 |
| 2024 | EUR 383.918 |
| 2025 | EUR 413.563 |
Hoger
200
Praktisch
110
Middelbaar
270
Europa
165
Nederland
965
Buiten Europa
60
Label G
145
Label A
142
Label C
96
Label D
82
Label F
80
Label B
63
Label E
38
Label A+++
14
Label A++++
7
Label A+
4
Label A++
3
Label A+++++
0
| Year | Gas (m3) | Electricity (kWh) |
|---|---|---|
| 2020 | 1.712 | 3.313 |
| 2021 | 1.969 | 3.451 |
| 2022 | 1.573 | 3.244 |
| 2023 | 1.286 | 3.141 |
| 2024 | 1.219 | 3.170 |
Hoekwoning
Gas: 804 • Electricity: 2.282
Huurwoning
Gas: 939 • Electricity: 2.024
Koopwoning
Gas: 1.386 • Electricity: 3.498
Appartement
Gas: 1.015 • Electricity: 2.417
Tussenwoning
Gas: 875 • Electricity: 2.177
Vrijstaande woning
Gas: 1.568 • Electricity: 3.799
Twee-onder-één-kap woning
Gas: 1.145 • Electricity: 2.725
Total number of company establishments: 200
| Period | Crimes |
|---|---|
| jan 2026 | 1 |
| jul 2025 | 0 |
| jun 2025 | 2 |
| mei 2025 | 3 |
| mrt 2025 | 1 |
| mrt 2026 | 1 |
| nov 2024 | 1 |
| nov 2025 | 2 |
| okt 2024 | 0 |
| okt 2025 | 0 |
| sep 2024 | 3 |
| sep 2025 | 2 |
These figures give an indicative picture of safety trends in the living environment of Noorbeek.
Short answers based on current local statistics, handy for a quick comparison of the living environment.
Noorbeek telt in 2026 ongeveer 1.165 inwoners.
De gemiddelde WOZ-waarde in Noorbeek is in 2025 circa € 413.563.
Het gemiddelde inkomen per inwoner in Noorbeek ligt rond € 28.958 per jaar.
Voor het huidige jaar gaat het om ongeveer 22 geregistreerde misdrijven. Gebruik deze cijfers als indicatie en vergelijk trends per periode.
In Noorbeek komt vooral "Vrijstaande woningen" veel voor, met ongeveer 192 woningen.