
Residents
18.820
Last year: 2025
2631ED Nootdorp • Zuid-Holland
€ 22.500 k.k.
Cost of copper (estimated): € 2.300
2% transfer tax (€ 450) + notary (€ 1.150) + valuation (€ 700)
Total incl. VAT: € 24.800
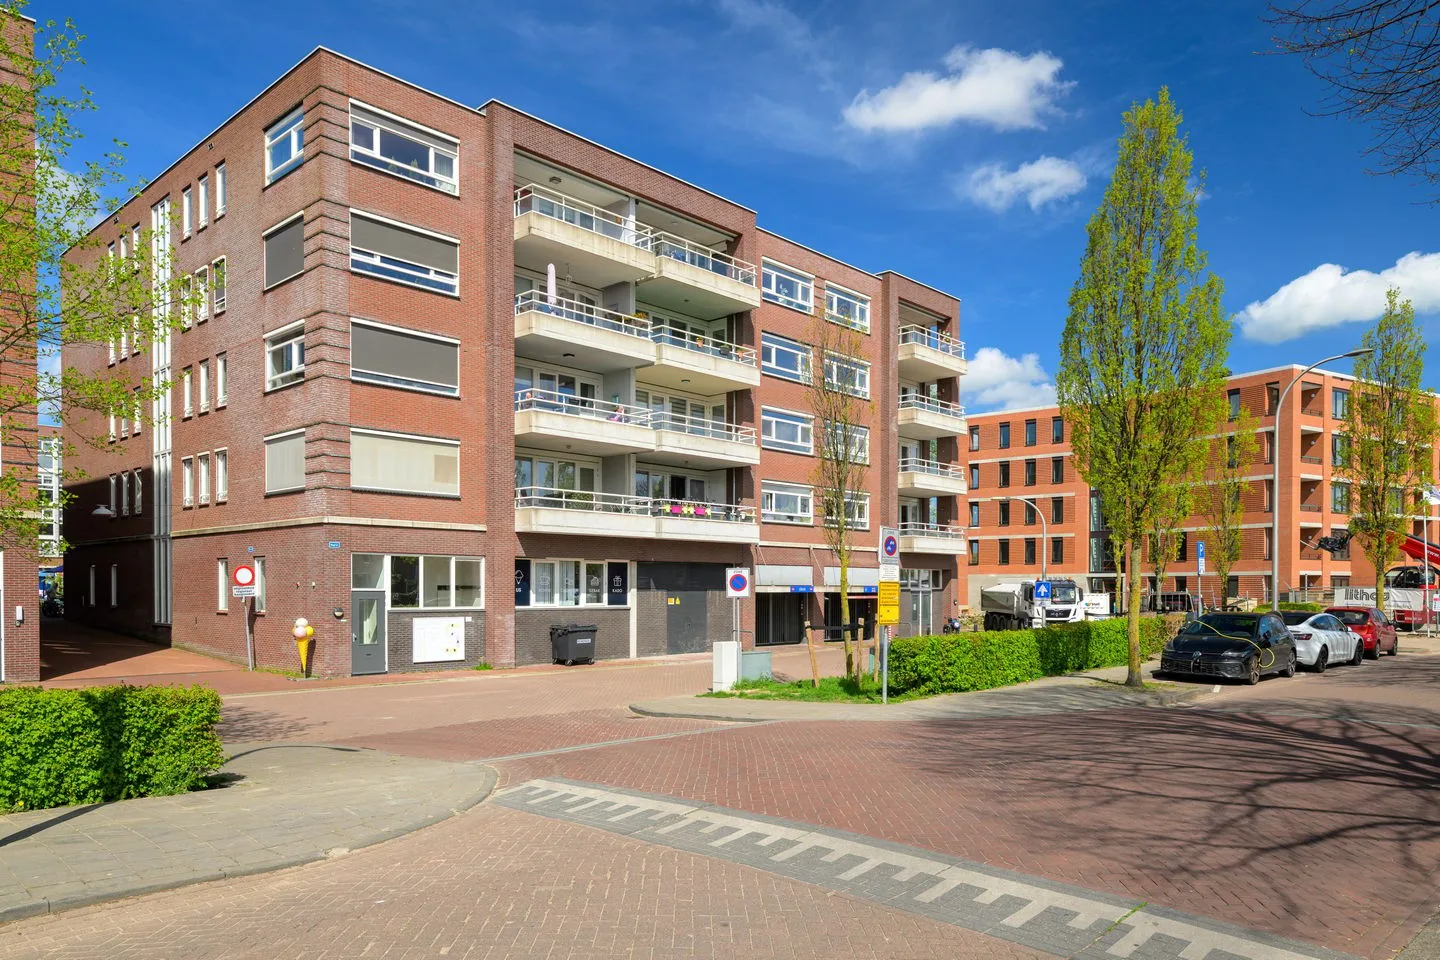
Parkeerplaats 444 in het centrum van Nootdorp, Markt 174 PP444, biedt een veilige en afgesloten parkeringsoplossing voor bewoners. De parkeergarage is toegankelijk via een sleutel en een elektrische pas, wat zorgt voor exclusiviteit. De locatie is strategisch gelegen en te bereiken via de tramlijn 15. De parkeerplaats is volledig eigendom en onderworpen aan de voorwaarden van de actieve VvE, waaronder een maandelijkse bijdrage van € 21,29. De garage heeft een doorrijhoogte van 2,00 meter en is bedoeld voor gebruik als parkeerplek. Oplevering van de parkeerplaats is in overleg. De verstrekte informatie dient als uitnodiging voor bod of onderhandeling. De makelaar Ruseler & Van Herk is met de voorwaarden van toepassing. Aan te raden is om een eigen NVM-aankoopmakelaar mee te nemen. De opgegeven gegevens en maten zijn indicatief, gebaseerd op de NEN2580-methode voor het bepalen van gebruiksoppervlakte. Eventuele interpretatieverschillen of afrondingen kunnen leiden tot kleine verschillen in de metingen.
€ 22.500
Cost of copper (estimated): € 2.300
2% transfer tax (€ 450) + notary (€ 1.150) + valuation (€ 700)
Total purchase (incl. p.p.): € 24.800
2,78%
Yearly
€ 1.125
Direct available
Estimated mortgage
Indicative gross monthly cost
Based on annuity and 30 year term
Indicative net monthly cost
iDisclaimer: this mortgage calculation is a simplified indication based on general assumptions. No rights can be derived from the results shown. Calculated with 10-annual interest (met NHG), automatically determined based on the price limit € 470.000. Source: 10-jaars rente uit mortgage_rates (04-05-2026 03:45).
Discover where agents are active in Nootdorp
View current location data on residents, WOZ development, housing stock, energy consumption, business activity and safety in Nootdorp. In 2025 were there 18.820 residents. The average WOZ value in 2025 is EUR 548.000.
Residents
18.820
Last year: 2025
Average WOZ
EUR 548.000
Last year: 2025
Average income per person.
EUR 40.200
Source: AllNumbers
Crimes (current year)
530
Total registered
| Year | Residents |
|---|---|
| 2021 | 19.000 |
| 2022 | 19.040 |
| 2023 | 19.020 |
| 2024 | 18.965 |
| 2025 | 18.820 |
| Year | Average WOZ |
|---|---|
| 2021 | EUR 407.000 |
| 2022 | EUR 432.000 |
| 2023 | EUR 512.000 |
| 2024 | EUR 523.000 |
| 2025 | EUR 548.000 |
Hoger
5.160
Praktisch
3.750
Middelbaar
5.430
Europa
1.530
Nederland
13.200
Buiten Europa
4.085
Label A
3.384
Label B
1.418
Label C
1.177
Label A+
588
Label D
311
Label F
174
Label E
157
Label A++
125
Label G
110
Label A+++
51
Label A+++++
9
Label A++++
6
| Year | Gas (m3) | Electricity (kWh) |
|---|---|---|
| 2020 | 800 | 3.270 |
| 2021 | 900 | 3.300 |
| 2022 | 690 | 3.060 |
| 2023 | 610 | 2.850 |
| 2024 | 590 | 2.890 |
Hoekwoning
Gas: 820 • Electricity: 2.890
Huurwoning
Gas: 460 • Electricity: 2.170
Koopwoning
Gas: 670 • Electricity: 3.130
Appartement
Gas: 290 • Electricity: 2.120
Tussenwoning
Gas: 550 • Electricity: 2.700
Vrijstaande woning
Gas: 1.130 • Electricity: 4.610
Twee-onder-één-kap woning
Gas: 780 • Electricity: 3.620
Total number of company establishments: 2.675
| Period | Crimes |
|---|---|
| jan 2025 | 43 |
| jan 2026 | 52 |
| jul 2025 | 41 |
| jun 2025 | 54 |
| mei 2025 | 44 |
| mrt 2025 | 31 |
| nov 2024 | 43 |
| nov 2025 | 41 |
| okt 2024 | 49 |
| okt 2025 | 45 |
| sep 2024 | 57 |
| sep 2025 | 41 |
These figures give an indicative picture of safety trends in the living environment of Nootdorp.
Short answers based on current local statistics, handy for a quick comparison of the living environment.
Nootdorp telt in 2025 ongeveer 18.820 inwoners.
De gemiddelde WOZ-waarde in Nootdorp is in 2025 circa € 548.000.
Het gemiddelde inkomen per inwoner in Nootdorp ligt rond € 40.200 per jaar.
Voor het huidige jaar gaat het om ongeveer 530 geregistreerde misdrijven. Gebruik deze cijfers als indicatie en vergelijk trends per periode.
In Nootdorp komt vooral "Tussenwoningen" veel voor, met ongeveer 2.889 woningen.
View more homes in this location.

2631ME Nootdorp
€ 685.000 k.k.
€ 4.363/m²

2631MK Nootdorp
€ 965.000 k.k.
€ 4.386/m²
2631XJ Nootdorp
€ 785.000 k.k.
€ 4.787/m²

2631LB Nootdorp
€ 649.000 k.k.
€ 5.110/m²

2632CA Nootdorp
€ 529.500 k.k.
€ 5.459/m²
2632GB Nootdorp
€ 440.000 k.k.
€ 5.176/m²

2631ED Nootdorp
€ 569.000 k.k.
2631ED Nootdorp
€ 490.000 k.k.
