Residents
6.200
Last year: 2025
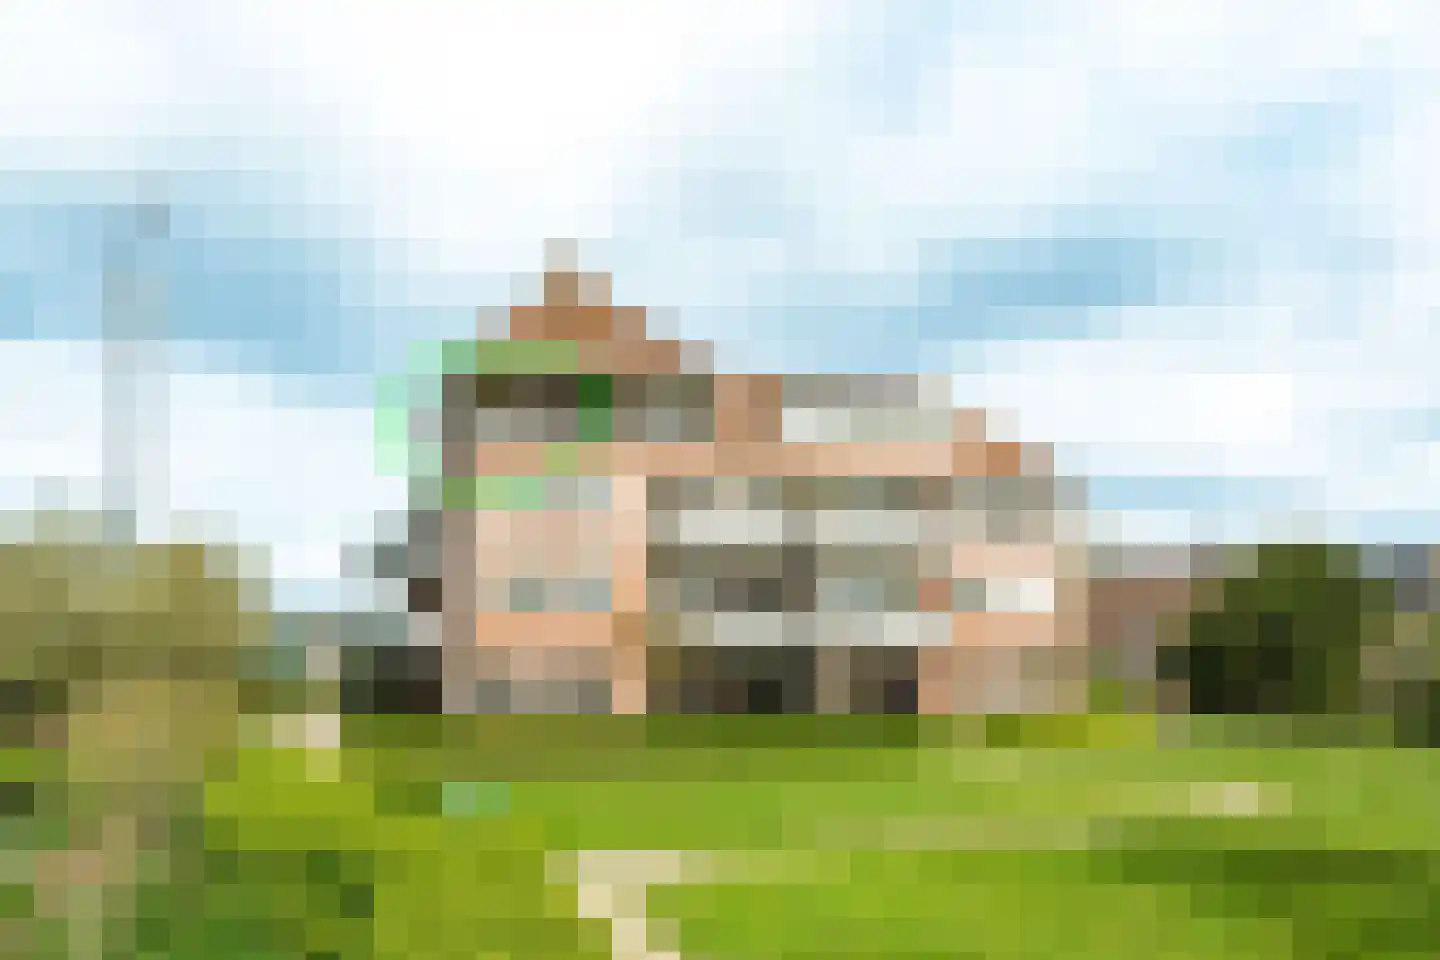
3984LN Odijk • Utrecht
€ 375.000 k.k.
Cost of copper (estimated): € 9.350
2% transfer tax (€ 7.500) + notary (€ 1.150) + valuation (€ 700)
Total incl. VAT: € 384.350
Purchase price /m²: € 4.870
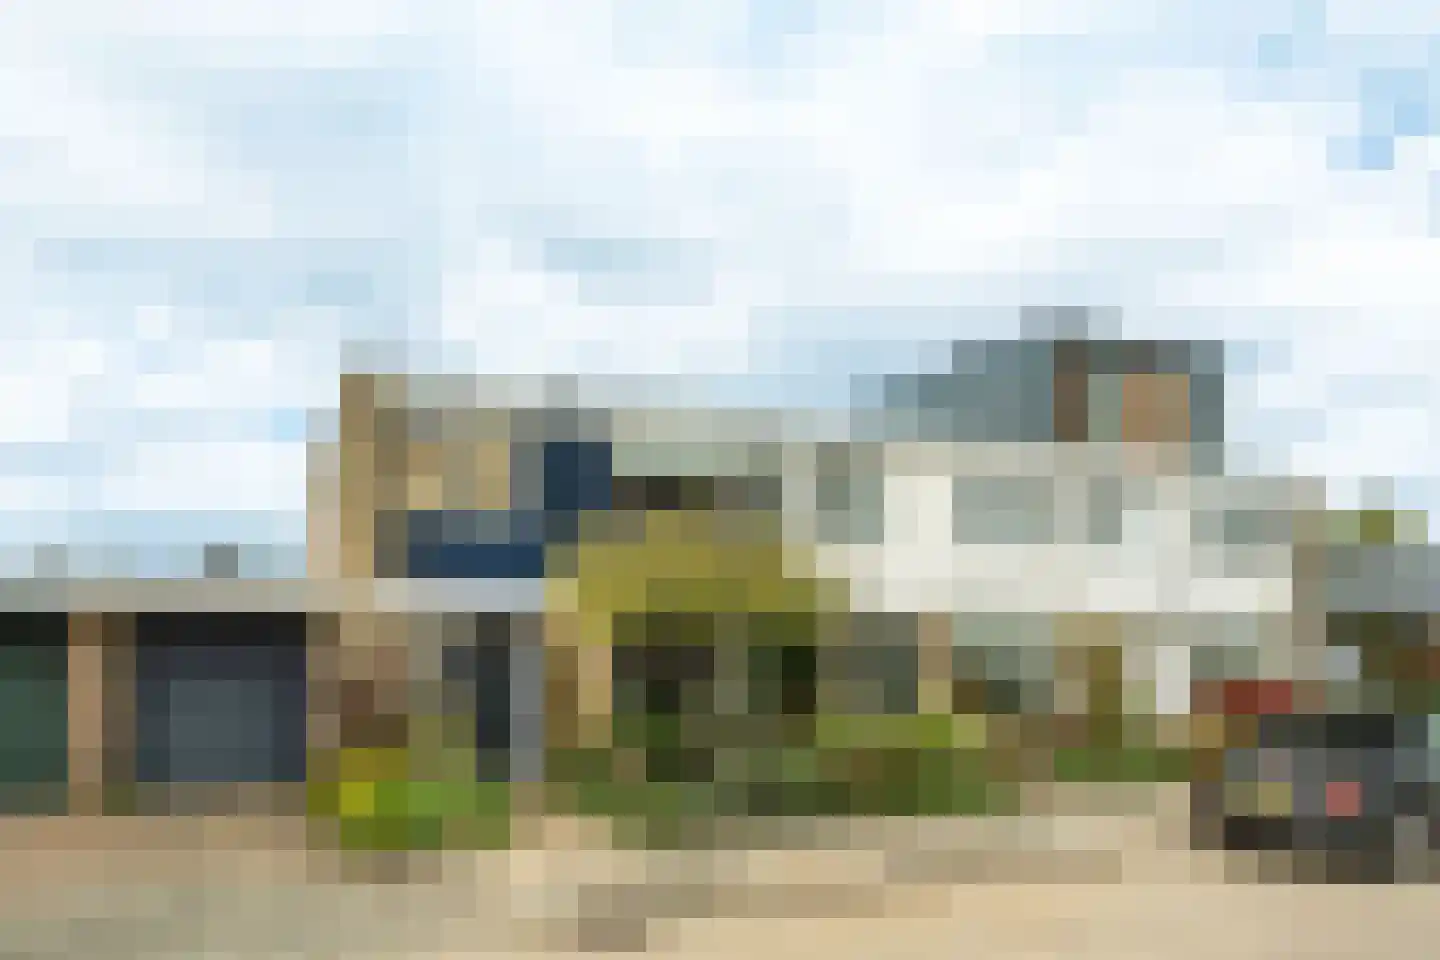
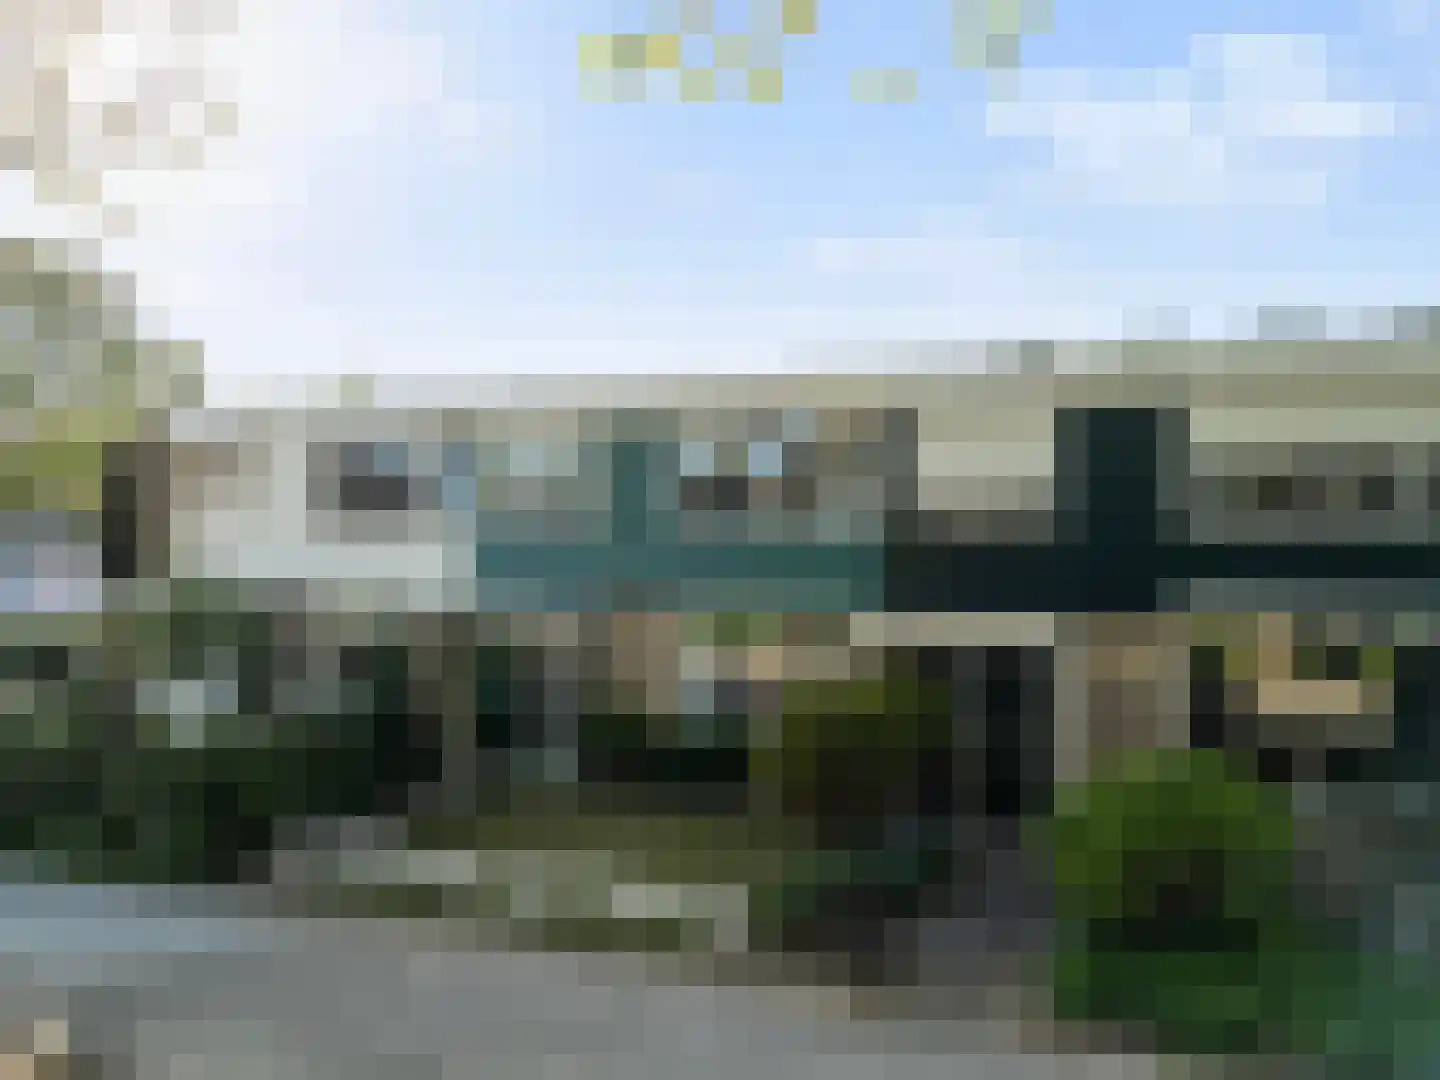
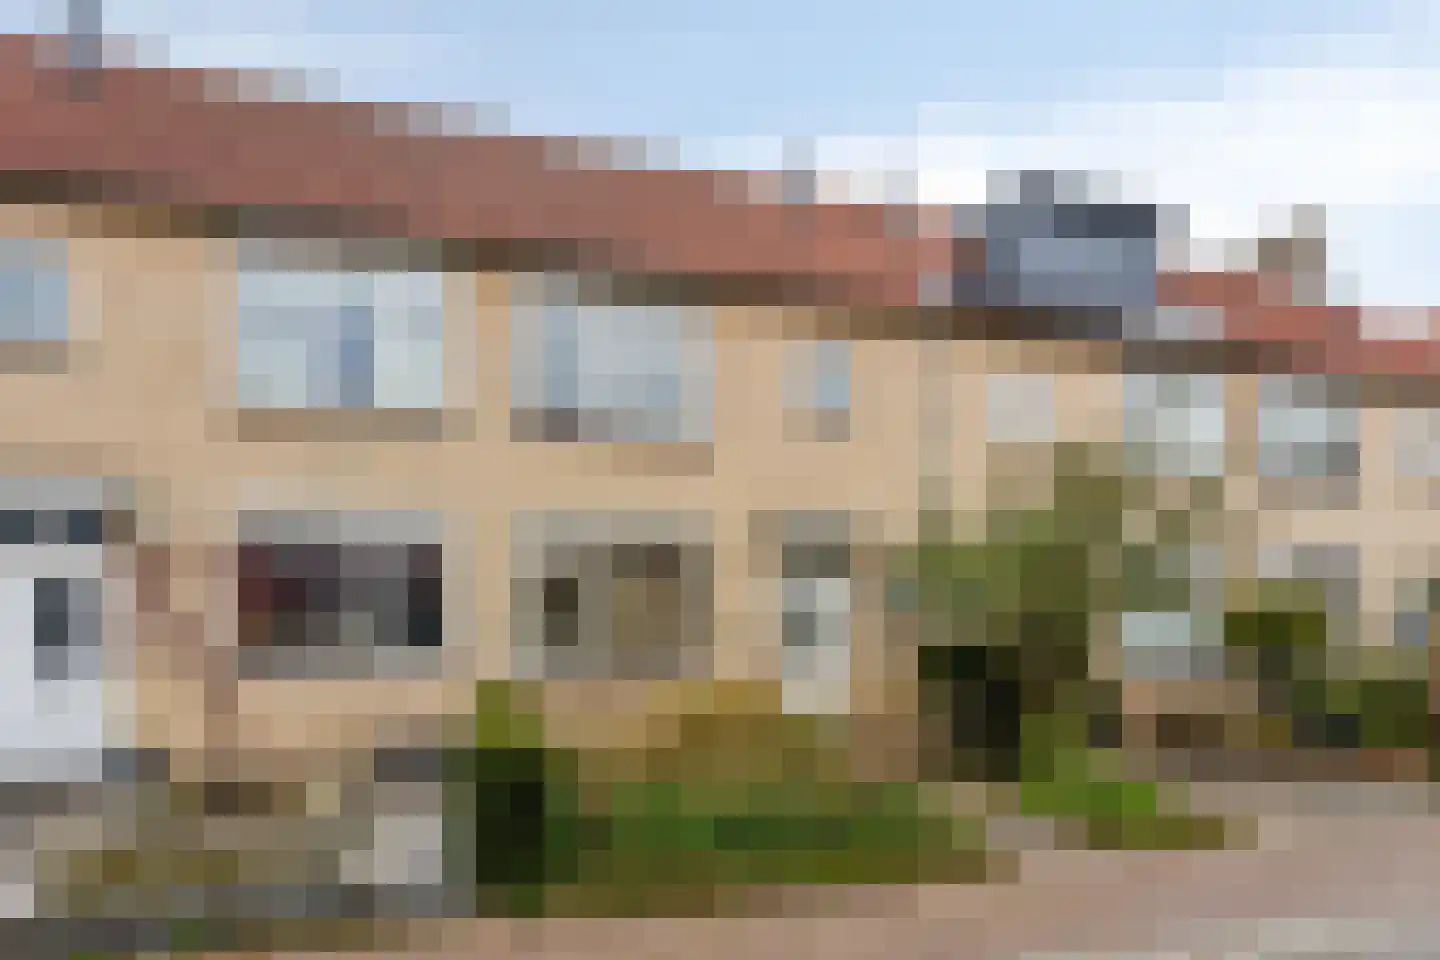
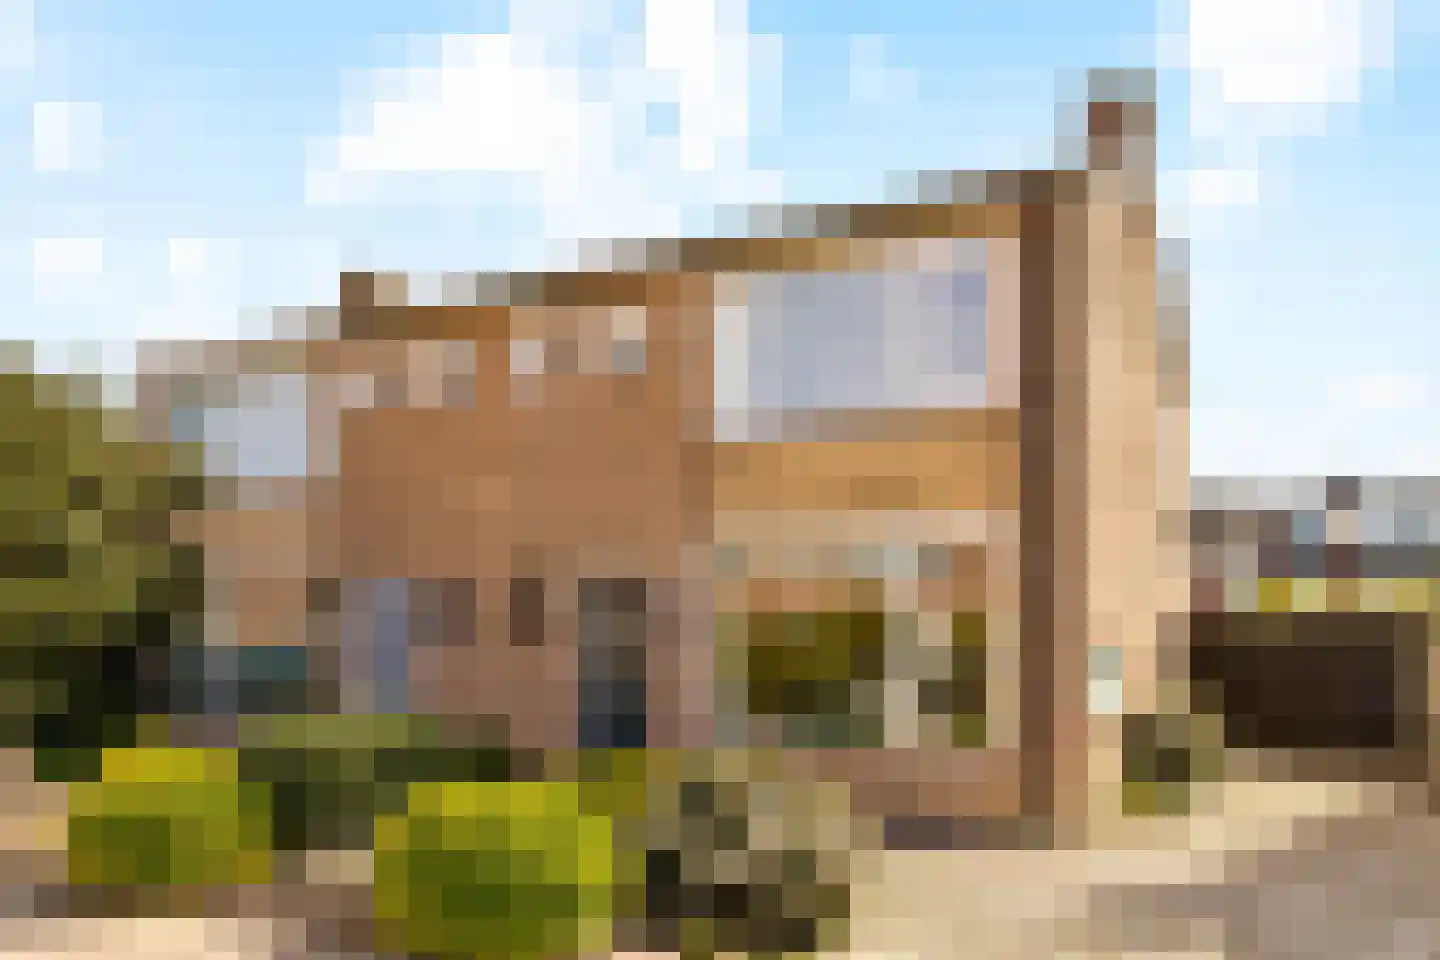
Fraai 3-kamer hoekappartement, gelegen op de 3e -tevens bovenste- verdieping van een kleinschalig en modern appartementencomplex, met ruim zonnig balkon, liftinstallatie, privé berging op de begane grond en een eigen parkeerplek aan de voorzijde van het appartementencomplex. Vanuit het appartement is er prachtig uitzicht over de gemeenschappelijke tuin en het aangrenzende natuurgebied. De ligging van dit appartement is ideaal: in een groene woonomgeving met volop privacy, maar toch op korte afstand van alle voorzieningen. Winkels, sportfaciliteiten, basisscholen en het gezondheidscentrum zijn allemaal lopend bereikbaar. Bovendien ben je binnen 10 autominuten in Utrecht of Zeist, en zijn de uitvalswegen en het openbaar vervoer uitstekend bereikbaar. Odijk ligt zeer centraal, met uitvalswegen naar de A12, en het openbaar vervoer is dichtbij. Het NS-station Driebergen-Zeist ligt op slechts 10 fietsminuten afstand. Vanaf hier vertrekken intercitytreinen rechtstreeks naar Utrecht, Amsterdam en Arnhem. Het Utrecht Science Park, met onder andere de Universiteit Utrecht en het UMC, is op maximaal 25 minuten fietsafstand. Begane grond: Centrale hal met tegelvloer, liftinstallatie, intercomsysteem, brievenbussen en eigen berging. Tevens is er een trappenhuis aanwezig. Derde verdieping: Entree, hal, toilet, berging met C.V.-opstelplaats en aansluiting witgoed, badkamer met inloopdouche en wastafel. Speelse en lichte woonkamer met vele raampartijen, vrij uitzicht en toegang tot het ruime overkapte balkon. De open keuken is voorzien van een keukenblok met gaskookplaat, afzuigkap, heteluchtoven en een koel-/vriescombinatie. Verder nog twee slaapkamers, waarvan één voorzien is van een kastenwand. Bijzonderheden: - Kleinschalig en jong appartementencomplex met lift. - Heerlijke groene omgeving met veel privacy. - Speels ingedeeld en licht appartement. - De gemeenschappelijke binnentuin grenst aan het natuurgebied en een aftakking van de Kromme Rijn. - Actieve VVE. Bijdrage is € 241,10 per maand. - Volledig geïsoleerd en voorzien van dubbele beglazing. - Eigen berging op de begane grond. - Privé parkeerplaats op het, aan de voorzijde van het gebouw, gelegen parkeerterrein. - Fraai aangelegde gemeenschappelijke tuin, onderhouden door een hoveniersbedrijf. - Voldoende openbaar parkeergelegenheid op het terrein rondom het gebouw. - Plattegronden en meetrapport aanwezig (NEN-2580). - Gebruiksoppervlakte wonen: 77 m². - Oplevering: in overleg, kan spoedig.
€ 375.000
Cost of copper (estimated): € 9.350
2% transfer tax (€ 7.500) + notary (€ 1.150) + valuation (€ 700)
Total purchase (incl. p.p.): € 384.350
3,02%
Yearly
€ 18.750
Direct available
Estimated mortgage
Indicative gross monthly cost
Based on annuity and 30 year term
Indicative net monthly cost
iDisclaimer: this mortgage calculation is a simplified indication based on general assumptions. No rights can be derived from the results shown. Calculated with 10-annual interest (met NHG), automatically determined based on the price limit € 470.000. Source: 10-jaars rente uit mortgage_rates (08-06-2026 03:45).
Inloopdouche en wastafelmeubel
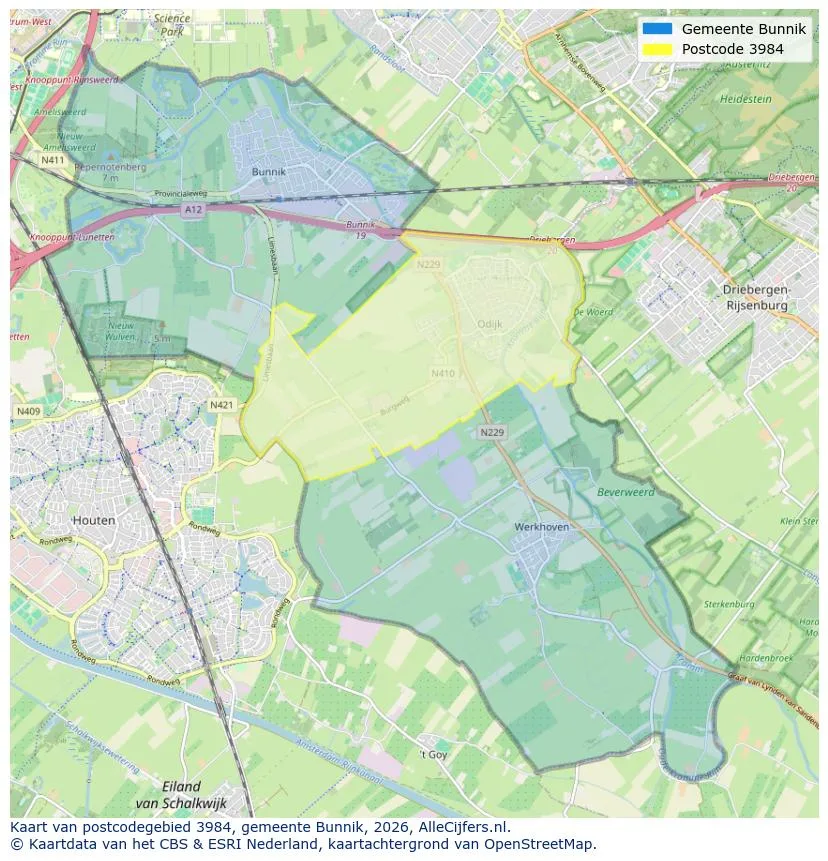
View the location and discover the brokers in this region
View current location data on residents, WOZ development, housing stock, energy consumption, business activity and safety in Odijk. In 2025 were there 6.200 residents. The average WOZ value in 2025 is EUR 532.000.
Residents
6.200
Last year: 2025
Average WOZ
EUR 532.000
Last year: 2025
Average income per person.
EUR 40.300
Source: AllNumbers
Crimes (current year)
122
Total registered
| Year | Residents |
|---|---|
| 2021 | 5.725 |
| 2022 | 5.855 |
| 2023 | 6.080 |
| 2024 | 6.125 |
| 2025 | 6.200 |
| Year | Average WOZ |
|---|---|
| 2021 | EUR 388.000 |
| 2022 | EUR 413.000 |
| 2023 | EUR 501.000 |
| 2024 | EUR 508.000 |
| 2025 | EUR 532.000 |
Hoger
1.930
Praktisch
960
Middelbaar
1.700
Europa
350
Nederland
5.150
Buiten Europa
700
Label C
984
Label A
640
Label B
362
Label D
231
Label A+++
123
Label A++
111
Label F
100
Label E
67
Label G
56
Label A+
54
Label A++++
1
Label A+++++
0
| Year | Gas (m3) | Electricity (kWh) |
|---|---|---|
| 2020 | 1.180 | 2.970 |
| 2021 | 1.330 | 2.990 |
| 2022 | 1.030 | 2.770 |
| 2023 | 870 | 2.670 |
| 2024 | 830 | 2.800 |
Hoekwoning
Gas: 950 • Electricity: 2.860
Huurwoning
Gas: 660 • Electricity: 2.010
Koopwoning
Gas: 940 • Electricity: 2.890
Appartement
Gas: 480 • Electricity: 1.730
Tussenwoning
Gas: 830 • Electricity: 2.500
Vrijstaande woning
Gas: 1.410 • Electricity: 4.290
Twee-onder-één-kap woning
Gas: 1.020 • Electricity: 3.100
Total number of company establishments: 785
| Period | Crimes |
|---|---|
| jan 2026 | 14 |
| jul 2025 | 12 |
| jun 2025 | 10 |
| mei 2025 | 12 |
| mrt 2025 | 10 |
| mrt 2026 | 12 |
| nov 2024 | 9 |
| nov 2025 | 8 |
| okt 2024 | 6 |
| okt 2025 | 14 |
| sep 2024 | 8 |
| sep 2025 | 8 |
These figures give an indicative picture of safety trends in the living environment of Odijk.
Short answers based on current local statistics, handy for a quick comparison of the living environment.
Odijk telt in 2025 ongeveer 6.200 inwoners.
De gemiddelde WOZ-waarde in Odijk is in 2025 circa € 532.000.
Het gemiddelde inkomen per inwoner in Odijk ligt rond € 40.300 per jaar.
Voor het huidige jaar gaat het om ongeveer 122 geregistreerde misdrijven. Gebruik deze cijfers als indicatie en vergelijk trends per periode.
In Odijk komt vooral "Tussenwoningen" veel voor, met ongeveer 1.098 woningen.
View more homes in this location.
3984PS Odijk
€ 1.050.000 k.k.
€ 5.526/m²
3984RB Odijk
€ 850.000 k.k.
€ 5.629/m²

3984RH Odijk
€ 995.000 k.k.
€ 6.104/m²

3984PS Odijk
€ 795.000 k.k.
3984JR Odijk
€ 550.000 k.k.
€ 5.093/m²
3984JA Odijk
€ 495.000 k.k.
€ 4.583/m²
3984CG Odijk
€ 485.000 k.k.
€ 5.052/m²
3984KJ Odijk
€ 469.000 k.k.
€ 4.598/m²
