Residents
6.200
Last year: 2025
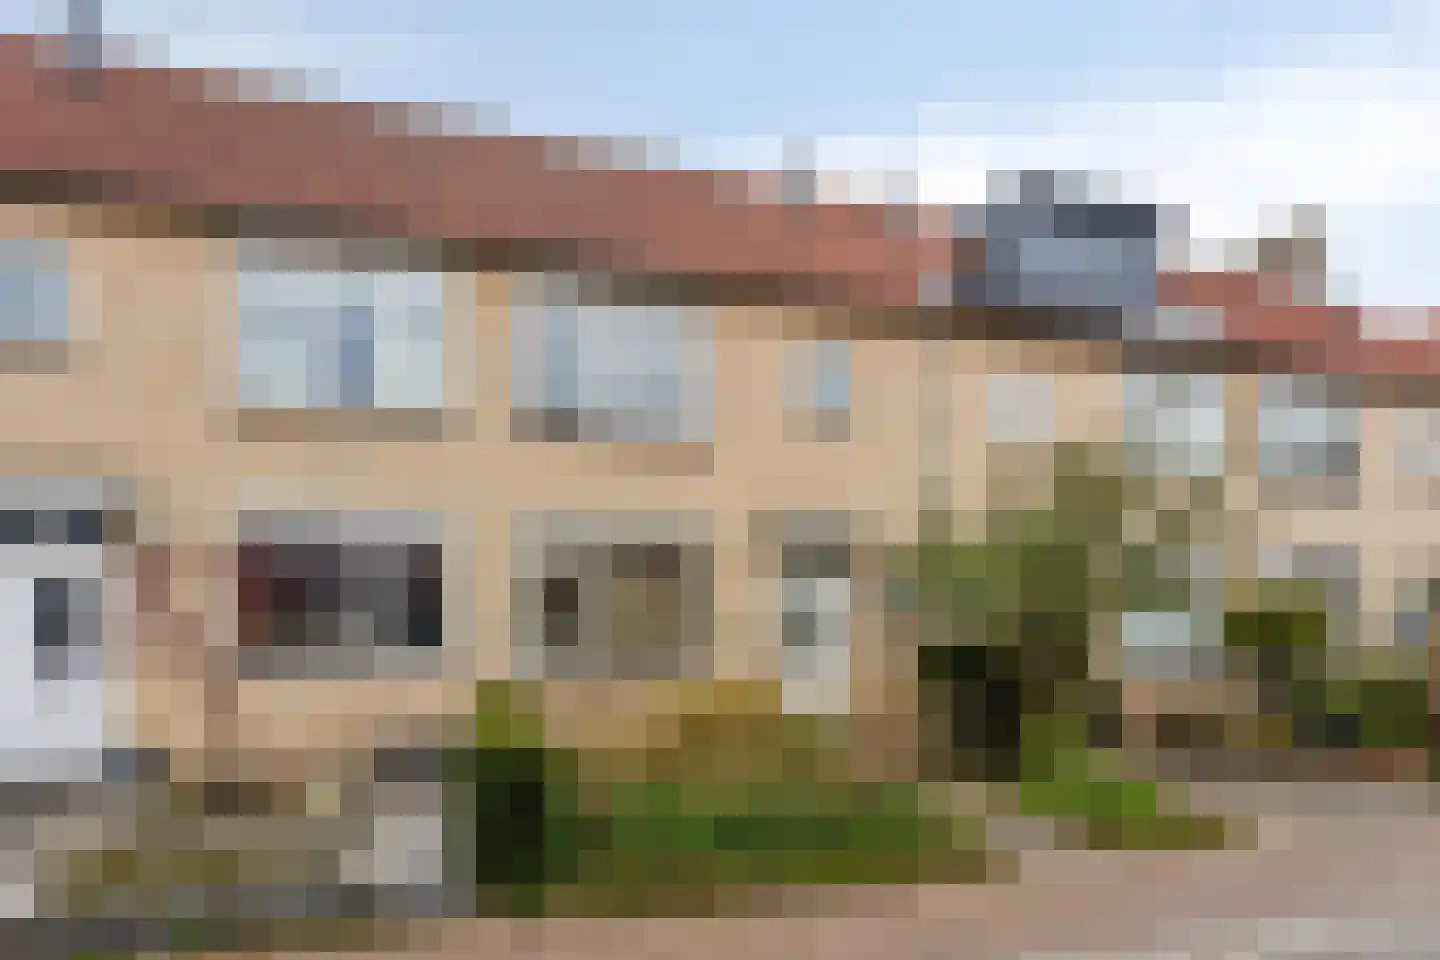
3984CG Odijk • Utrecht
€ 485.000 k.k.
Cost of copper (estimated): € 11.550
2% transfer tax (€ 9.700) + notary (€ 1.150) + valuation (€ 700)
Total incl. VAT: € 496.550
Purchase price /m²: € 5.052
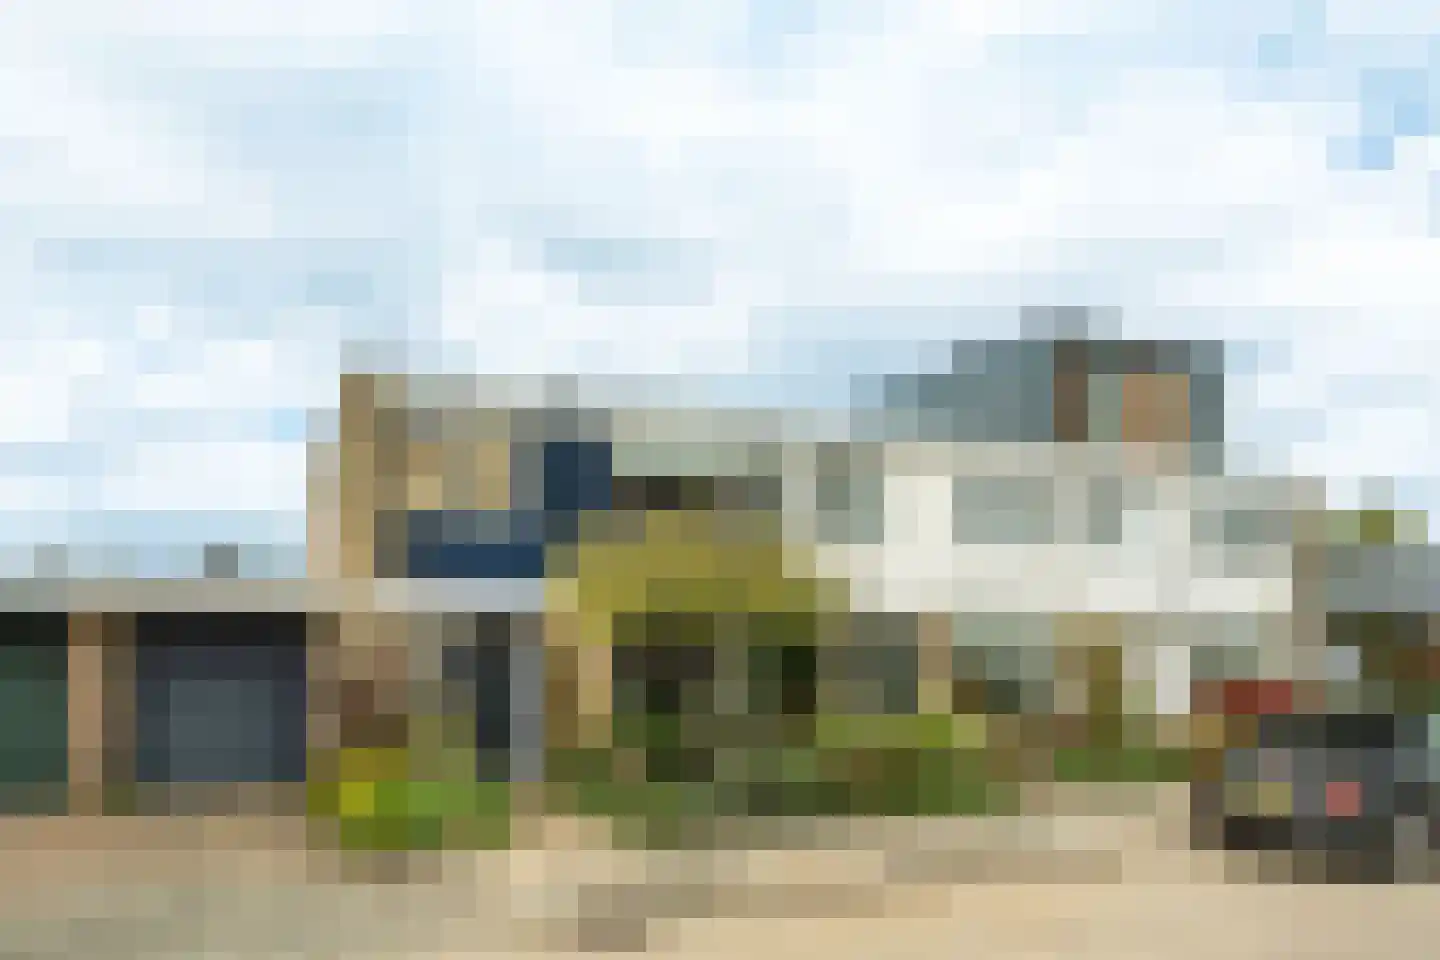
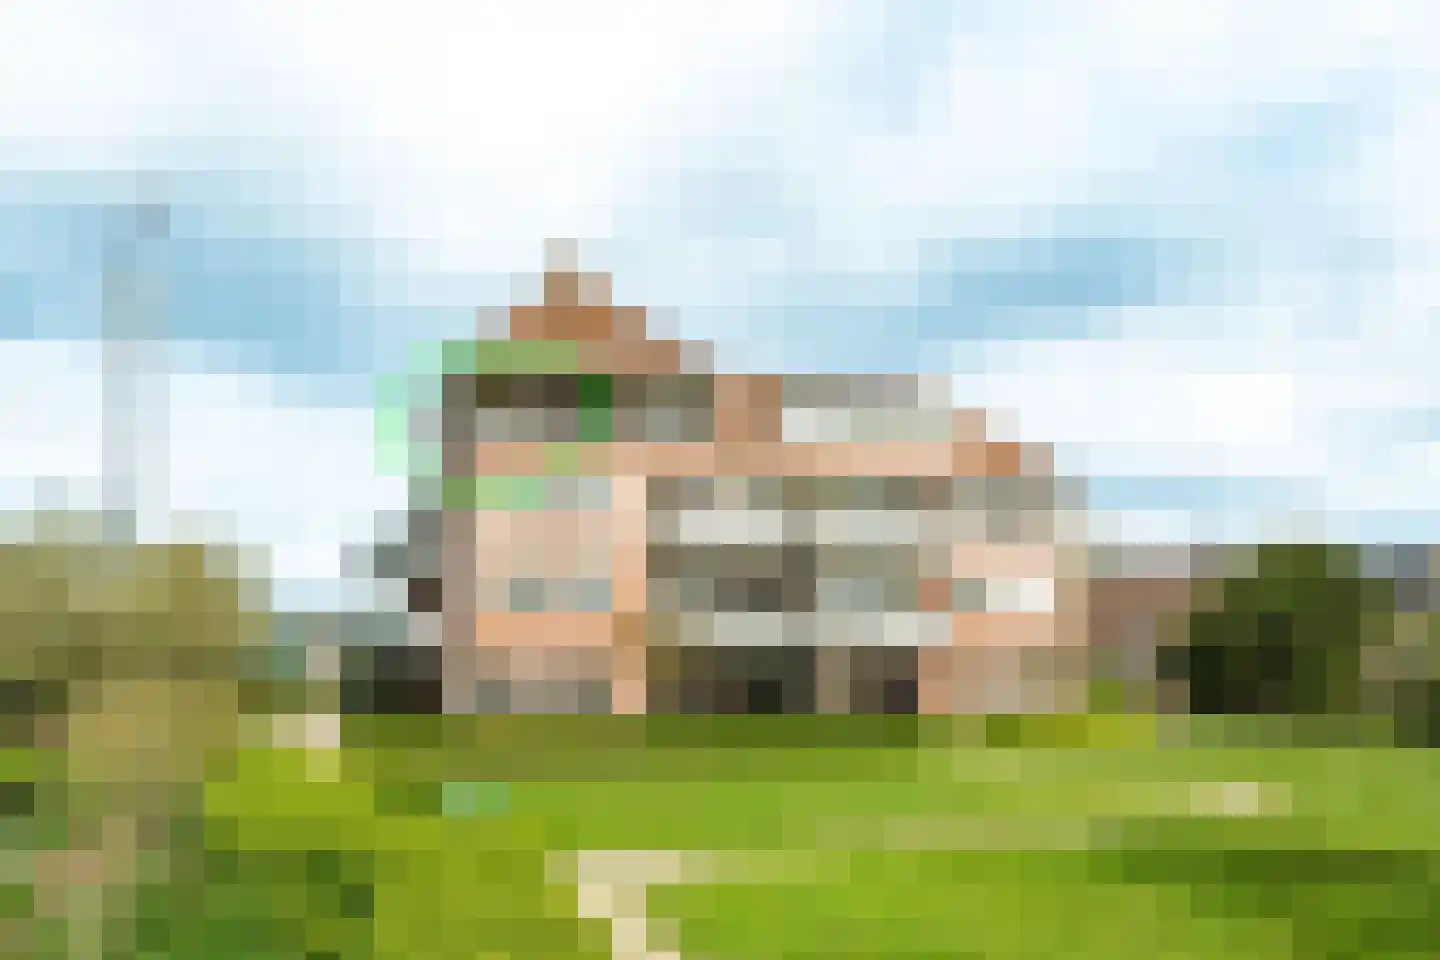
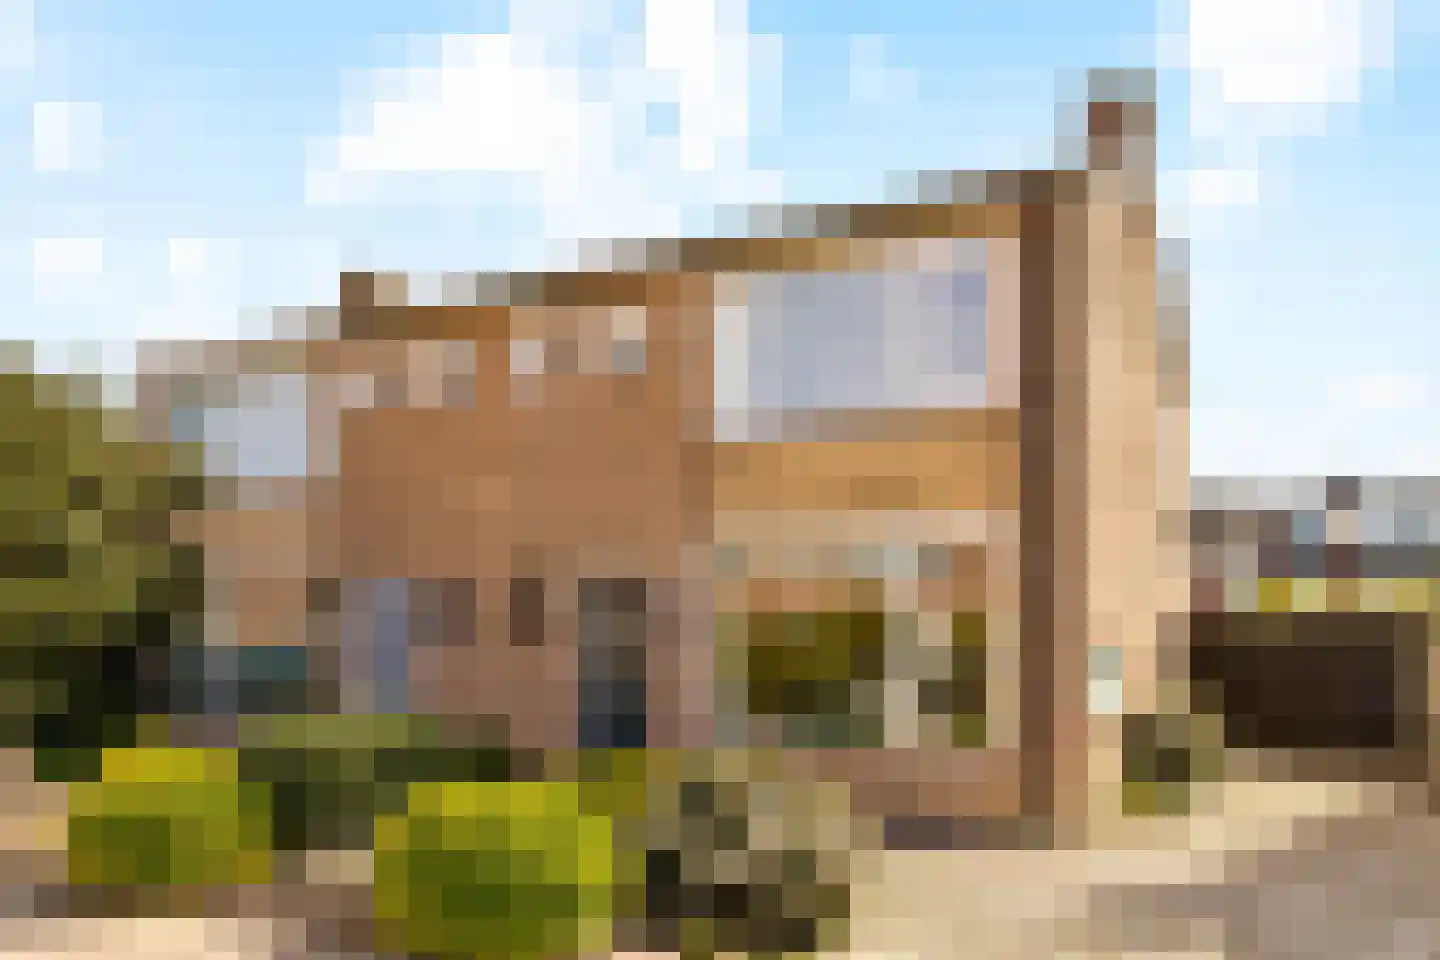
Rustig gelegen en keurig onderhouden woning met een fijne tuin op het westen. Snel bezichtigen? Dat kan! Ook op zaterdag en zondag! Je kunt deze woning direct bezichtigen zonder dat onze makelaar daarbij aanwezig is. Plan je bezichtiging op de website van de woning (link in brochure) en krijg toegang tot de woning op een dag en tijd die jou het beste past. Liever persoonlijk contact? Dat kan zeker ook, bel dan met de verkopende makelaar of klik op de button: "plan een bezichtiging". De bezichtiging zelf is wel altijd zonder makelaar. Deze tussenwoning uit 1989 staat op een perceel van 126 m² en heeft een circa 9 meter diepe achtertuin op het westen, dus lekker de avondzon! Begane grond Entree met meterkast en modern wit toilet. De woonkamer is lekker licht en heeft een nette vloerafwerking. De open keuken is in 2023 opnieuw ingericht en uitgerust met een inductiekookplaat, vaatwasser, combimagnetron en afzuigkap. Vanuit de woonkamer bereik je de aangebouwde berging. Eerste verdieping Overloop met toegang tot twee goed bemeten slaapkamers. De slaapkamer aan de achterzijde strekt zich uit over de volle breedte van de woning en is voorzien van een dakkapel, dit zorgt voor extra ruimte en licht. De moderne badkamer beschikt over een inloopdouche, wastafel en tweede toilet. Tweede verdieping Open zolderruimte met mechanische ventilatie-unit, Intergas cv-ketel (2019) en wasmachineaansluiting. Hier kan eenvoudig een volwaardige derde slaapkamer, werkruimte of hobbykamer worden gerealiseerd. Buitenruimte De achtertuin ligt op het westen, waardoor je in de avond heerlijk van de zon geniet. Via de brandgang is de tuin achterom bereikbaar. Omgeving De woning ligt in een rustige, kindvriendelijke woonwijk in Odijk met veel groen en speelvoorzieningen in de directe omgeving. Basisscholen, kinderopvang, sportfaciliteiten en het dorpscentrum met supermarkten en dagelijkse winkels bevinden zich op korte afstand. De bereikbaarheid is uitstekend. Binnen enkele minuten bereik je de uitvalswegen richting de A12 en A27. Utrecht, Bunnik en Zeist zijn snel bereikbaar, zowel met de auto als per fiets. Station Bunnik ligt op korte afstand, waardoor je ook met het openbaar vervoer vlot in Utrecht en verder reist. Hier woon je rustig, maar toch centraal. Bijzonderheden: - School en buurtwinkelcentrum op korte loop- of fietsafstand. - Snelle oplevering mogelijk - Projectnotaris: Drost Juten netwerk notarissen De verkoper heeft de woning niet zelf bewoond. Hierdoor zijn aanvullende voorwaarden van toepassing, die je kunt downloaden van de eigen website van de woning (zie brochure voor de link). De koopovereenkomst komt pas tot stand na uitdrukkelijke toestemming van de directie van Vesteda Investment Management B.V., wat blijkt uit het ondertekenen van de koopovereenkomst.
€ 485.000
Cost of copper (estimated): € 11.550
2% transfer tax (€ 9.700) + notary (€ 1.150) + valuation (€ 700)
Total purchase (incl. p.p.): € 496.550
3,21%
Yearly
€ 24.250
Direct available
Estimated mortgage
Indicative gross monthly cost
Based on annuity and 30 year term
Indicative net monthly cost
iDisclaimer: this mortgage calculation is a simplified indication based on general assumptions. No rights can be derived from the results shown. Calculated with 10-annual interest (zonder NHG), automatically determined based on the price limit € 470.000. Source: 10-jaars rente uit mortgage_rates (07-06-2026 03:45). For non-NHG, an 80% mortgage of the market value has been used in this indication.
Douche, toilet, en wastafel
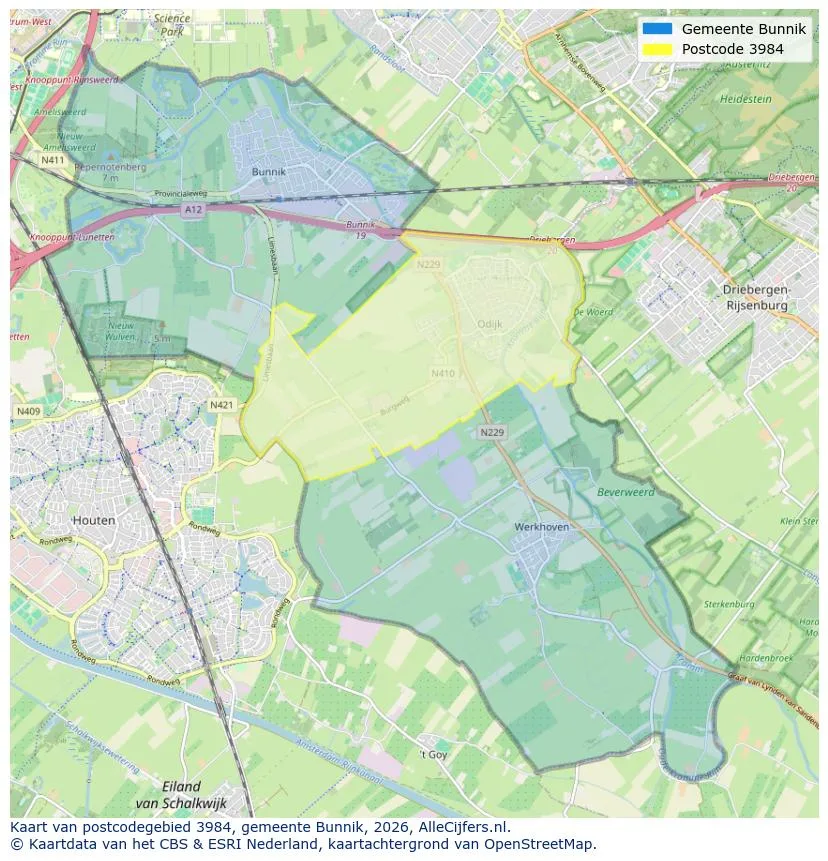
View the location and discover the brokers in this region
View current location data on residents, WOZ development, housing stock, energy consumption, business activity and safety in Odijk. In 2025 were there 6.200 residents. The average WOZ value in 2025 is EUR 532.000.
Residents
6.200
Last year: 2025
Average WOZ
EUR 532.000
Last year: 2025
Average income per person.
EUR 40.300
Source: AllNumbers
Crimes (current year)
122
Total registered
| Year | Residents |
|---|---|
| 2021 | 5.725 |
| 2022 | 5.855 |
| 2023 | 6.080 |
| 2024 | 6.125 |
| 2025 | 6.200 |
| Year | Average WOZ |
|---|---|
| 2021 | EUR 388.000 |
| 2022 | EUR 413.000 |
| 2023 | EUR 501.000 |
| 2024 | EUR 508.000 |
| 2025 | EUR 532.000 |
Hoger
1.930
Praktisch
960
Middelbaar
1.700
Europa
350
Nederland
5.150
Buiten Europa
700
Label C
984
Label A
640
Label B
362
Label D
231
Label A+++
123
Label A++
111
Label F
100
Label E
67
Label G
56
Label A+
54
Label A++++
1
Label A+++++
0
| Year | Gas (m3) | Electricity (kWh) |
|---|---|---|
| 2020 | 1.180 | 2.970 |
| 2021 | 1.330 | 2.990 |
| 2022 | 1.030 | 2.770 |
| 2023 | 870 | 2.670 |
| 2024 | 830 | 2.800 |
Hoekwoning
Gas: 950 • Electricity: 2.860
Huurwoning
Gas: 660 • Electricity: 2.010
Koopwoning
Gas: 940 • Electricity: 2.890
Appartement
Gas: 480 • Electricity: 1.730
Tussenwoning
Gas: 830 • Electricity: 2.500
Vrijstaande woning
Gas: 1.410 • Electricity: 4.290
Twee-onder-één-kap woning
Gas: 1.020 • Electricity: 3.100
Total number of company establishments: 785
| Period | Crimes |
|---|---|
| jan 2026 | 14 |
| jul 2025 | 12 |
| jun 2025 | 10 |
| mei 2025 | 12 |
| mrt 2025 | 10 |
| mrt 2026 | 12 |
| nov 2024 | 9 |
| nov 2025 | 8 |
| okt 2024 | 6 |
| okt 2025 | 14 |
| sep 2024 | 8 |
| sep 2025 | 8 |
These figures give an indicative picture of safety trends in the living environment of Odijk.
Short answers based on current local statistics, handy for a quick comparison of the living environment.
Odijk telt in 2025 ongeveer 6.200 inwoners.
De gemiddelde WOZ-waarde in Odijk is in 2025 circa € 532.000.
Het gemiddelde inkomen per inwoner in Odijk ligt rond € 40.300 per jaar.
Voor het huidige jaar gaat het om ongeveer 122 geregistreerde misdrijven. Gebruik deze cijfers als indicatie en vergelijk trends per periode.
In Odijk komt vooral "Tussenwoningen" veel voor, met ongeveer 1.098 woningen.
View more homes in this location.
3984PS Odijk
€ 1.050.000 k.k.
€ 5.526/m²
3984RB Odijk
€ 850.000 k.k.
€ 5.629/m²

3984RH Odijk
€ 995.000 k.k.
€ 6.104/m²

3984PS Odijk
€ 795.000 k.k.
3984JR Odijk
€ 550.000 k.k.
€ 5.093/m²

3984JA Odijk
€ 495.000 k.k.
€ 4.583/m²
3984LN Odijk
€ 375.000 k.k.
€ 4.870/m²
3984KJ Odijk
€ 469.000 k.k.
€ 4.598/m²
