
Residents
1.005
Last year: 2025
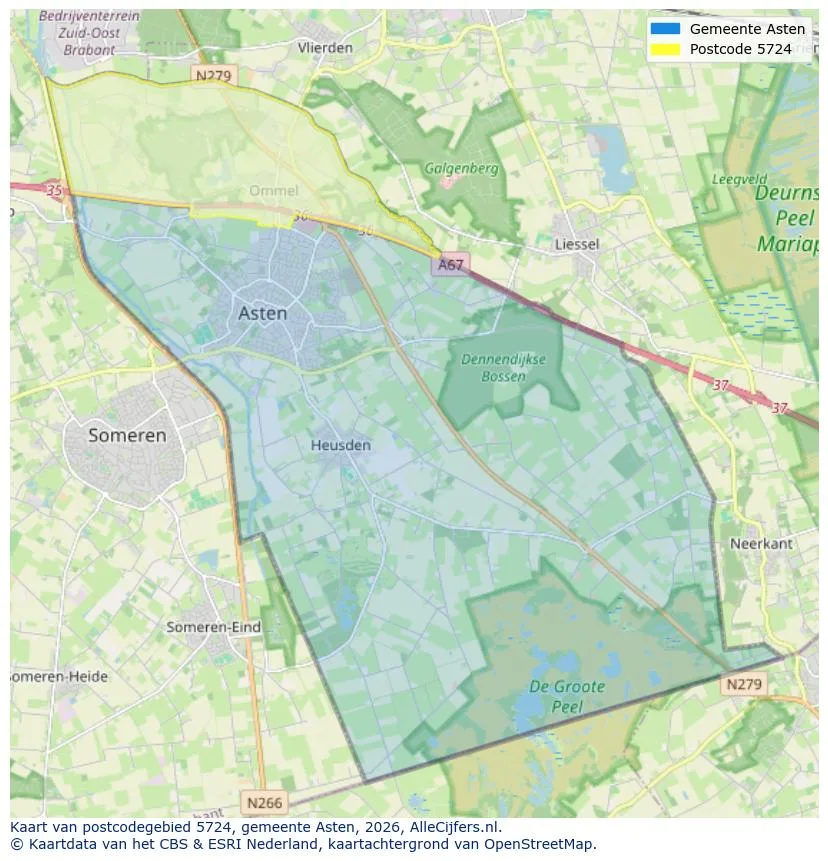
5724PM Ommel • Noord-Brabant
€ 650.000 k.k.
Cost of copper (estimated): € 14.850
2% transfer tax (€ 13.000) + notary (€ 1.150) + valuation (€ 700)
Total incl. VAT: € 664.850
Purchase price /m²: € 2.600
Woning direct verkocht Lees de volledige omschrijving
€ 650.000
Cost of copper (estimated): € 14.850
2% transfer tax (€ 13.000) + notary (€ 1.150) + valuation (€ 700)
Total purchase (incl. p.p.): € 664.850
3,04%
Yearly
€ 32.500
Direct available
Estimated mortgage
Indicative gross monthly cost
Based on annuity and 30 year term
Indicative net monthly cost
iDisclaimer: this mortgage calculation is a simplified indication based on general assumptions. No rights can be derived from the results shown. Calculated with 10-annual interest (zonder NHG), automatically determined based on the price limit € 470.000. Source: 10-jaars rente uit mortgage_rates (05-05-2026 03:45). For non-NHG, an 80% mortgage of the market value has been used in this indication.
View the location and discover the brokers in this region
View current location data on residents, WOZ development, housing stock, energy consumption, business activity and safety in Ommel. In 2025 were there 1.005 residents. The average WOZ value in 2025 is EUR 505.650.
Residents
1.005
Last year: 2025
Average WOZ
EUR 505.650
Last year: 2025
Average income per person.
EUR 31.105
Source: AllNumbers
Crimes (current year)
44
Total registered
| Year | Residents |
|---|---|
| 2021 | 1.085 |
| 2022 | 1.050 |
| 2023 | 1.045 |
| 2024 | 1.035 |
| 2025 | 1.005 |
| Year | Average WOZ |
|---|---|
| 2021 | EUR 391.933 |
| 2022 | EUR 430.359 |
| 2023 | EUR 477.607 |
| 2024 | EUR 480.063 |
| 2025 | EUR 505.650 |
Hoger
220
Praktisch
150
Middelbaar
380
Europa
95
Nederland
885
Buiten Europa
20
Label C
82
Label A
61
Label B
58
Label F
43
Label G
36
Label D
28
Label A+++
19
Label E
7
Label A++++
5
Label A+
3
Label A++
0
Label A+++++
0
| Year | Gas (m3) | Electricity (kWh) |
|---|---|---|
| 2020 | 1.723 | 4.205 |
| 2021 | 1.940 | 4.313 |
| 2022 | 1.526 | 3.998 |
| 2023 | 1.266 | 3.897 |
| 2024 | 1.146 | 3.937 |
Hoekwoning
Gas: 985 • Electricity: 3.141
Huurwoning
Gas: 1.428 • Electricity: 2.994
Koopwoning
Gas: 1.201 • Electricity: 3.969
Appartement
Gas: 1.526 • Electricity: 3.575
Tussenwoning
Gas: 768 • Electricity: 2.846
Vrijstaande woning
Gas: 1.375 • Electricity: 4.429
Twee-onder-één-kap woning
Gas: 1.260 • Electricity: 3.328
Total number of company establishments: 150
| Period | Crimes |
|---|---|
| jan 2025 | 1 |
| jan 2026 | 3 |
| jul 2025 | 3 |
| jun 2025 | 6 |
| mei 2025 | 2 |
| mrt 2025 | 5 |
| nov 2024 | 3 |
| nov 2025 | 5 |
| okt 2024 | 5 |
| okt 2025 | 3 |
| sep 2024 | 6 |
| sep 2025 | 3 |
These figures give an indicative picture of safety trends in the living environment of Ommel.
Short answers based on current local statistics, handy for a quick comparison of the living environment.
Ommel telt in 2025 ongeveer 1.005 inwoners.
De gemiddelde WOZ-waarde in Ommel is in 2025 circa € 505.650.
Het gemiddelde inkomen per inwoner in Ommel ligt rond € 31.105 per jaar.
Voor het huidige jaar gaat het om ongeveer 44 geregistreerde misdrijven. Gebruik deze cijfers als indicatie en vergelijk trends per periode.
In Ommel komt vooral "Vrijstaande woningen" veel voor, met ongeveer 185 woningen.
View more homes in this location.

5724AR Ommel
€ 625.000 k.k.
€ 3.591/m²
5724AT Ommel
€ 965.000 k.k.
€ 4.801/m²

5724AW Ommel
€ 462.035 k.k.
€ 0/m²

5724AW Ommel
€ 649.000 k.k.
€ 0/m²

5724AE Ommel
€ 775.000 k.k.
€ 5.065/m²

5724AD Ommel
€ 625.000 k.k.
€ 4.464/m²

5724AB Ommel
€ 330.000 k.k.
€ 3.510/m²

5724AB Ommel
€ 320.000 k.k.
€ 4.848/m²

