
Residents
1.235
Last year: 2025
4909BN Oosteind • Noord-Brabant
€ 975.000 k.k.
Cost of copper (estimated): € 21.350
2% transfer tax (€ 19.500) + notary (€ 1.150) + valuation (€ 700)
Total incl. VAT: € 996.350
Purchase price /m²: € 3.884
Woning aan de Hoge Dijk 90 in Oosteind per direct verkocht. Lees de volledige omschrijving
€ 975.000
Cost of copper (estimated): € 21.350
2% transfer tax (€ 19.500) + notary (€ 1.150) + valuation (€ 700)
Total purchase (incl. p.p.): € 996.350
3,04%
Yearly
€ 48.750
Direct available
Estimated mortgage
Indicative gross monthly cost
Based on annuity and 30 year term
Indicative net monthly cost
iDisclaimer: this mortgage calculation is a simplified indication based on general assumptions. No rights can be derived from the results shown. Calculated with 10-annual interest (zonder NHG), automatically determined based on the price limit € 470.000. Source: 10-jaars rente uit mortgage_rates (04-05-2026 03:45). For non-NHG, an 80% mortgage of the market value has been used in this indication.
Douche, ligbad, en wastafel
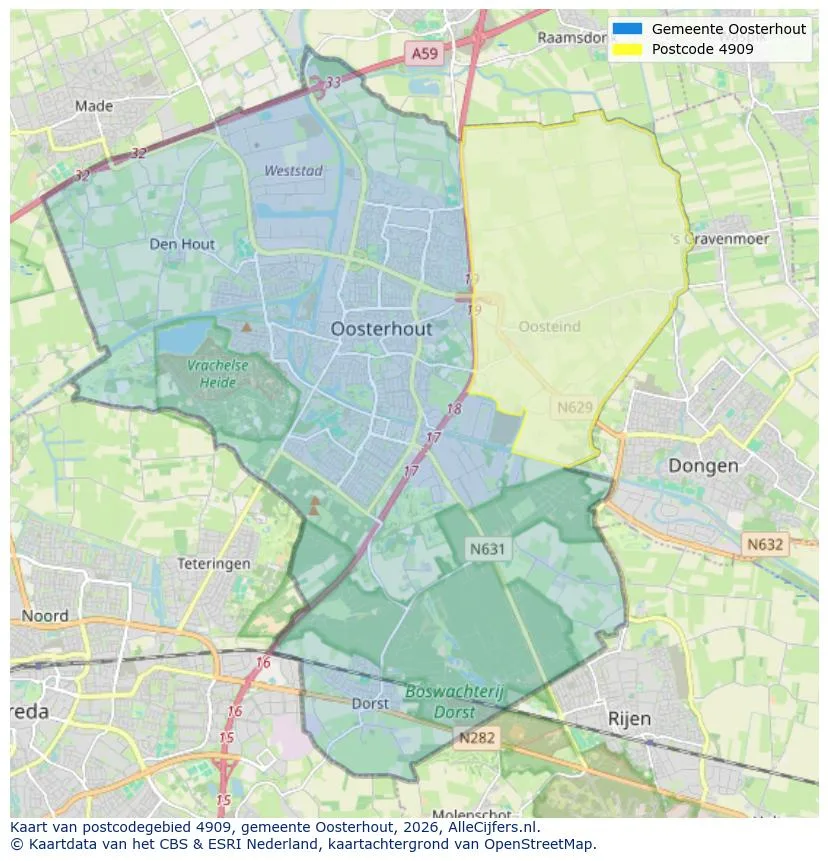
Spatial overview of the work area in Oosteind
View current location data on residents, WOZ development, housing stock, energy consumption, business activity and safety in Oosteind. In 2025 were there 1.235 residents. The average WOZ value in 2025 is EUR 535.000.
Residents
1.235
Last year: 2025
Average WOZ
EUR 535.000
Last year: 2025
Average income per person.
EUR 35.700
Source: AllNumbers
Crimes (current year)
41
Total registered
| Year | Residents |
|---|---|
| 2021 | 1.210 |
| 2022 | 1.220 |
| 2023 | 1.240 |
| 2024 | 1.240 |
| 2025 | 1.235 |
| Year | Average WOZ |
|---|---|
| 2021 | EUR 421.000 |
| 2022 | EUR 447.000 |
| 2023 | EUR 488.000 |
| 2024 | EUR 499.000 |
| 2025 | EUR 535.000 |
Hoger
270
Praktisch
200
Middelbaar
530
Europa
110
Nederland
1.085
Buiten Europa
45
Label G
119
Label C
95
Label A
93
Label D
72
Label B
64
Label F
48
Label E
17
Label A+
3
Label A++
2
Label A+++
2
Label A++++
0
Label A+++++
0
| Year | Gas (m3) | Electricity (kWh) |
|---|---|---|
| 2020 | 1.760 | 4.080 |
| 2021 | 1.990 | 4.140 |
| 2022 | 1.480 | 3.890 |
| 2023 | 1.250 | 3.760 |
| 2024 | 1.160 | 3.820 |
Hoekwoning
Gas: 850 • Electricity: 3.280
Huurwoning
Gas: 1.350 • Electricity: 3.410
Koopwoning
Gas: 1.240 • Electricity: 3.810
Appartement
Gas: 1.440 • Electricity: 3.080
Tussenwoning
Gas: 780 • Electricity: 2.610
Vrijstaande woning
Gas: 1.400 • Electricity: 4.230
Twee-onder-één-kap woning
Gas: 1.180 • Electricity: 3.190
Total number of company establishments: 275
| Period | Crimes |
|---|---|
| jan 2026 | 4 |
| jul 2025 | 4 |
| jun 2025 | 2 |
| mei 2025 | 3 |
| mrt 2025 | 3 |
| mrt 2026 | 3 |
| nov 2024 | 3 |
| nov 2025 | 5 |
| okt 2024 | 1 |
| okt 2025 | 5 |
| sep 2024 | 3 |
| sep 2025 | 4 |
These figures give an indicative picture of safety trends in the living environment of Oosteind.
Short answers based on current local statistics, handy for a quick comparison of the living environment.
Oosteind telt in 2025 ongeveer 1.235 inwoners.
De gemiddelde WOZ-waarde in Oosteind is in 2025 circa € 535.000.
Het gemiddelde inkomen per inwoner in Oosteind ligt rond € 35.700 per jaar.
Voor het huidige jaar gaat het om ongeveer 41 geregistreerde misdrijven. Gebruik deze cijfers als indicatie en vergelijk trends per periode.
In Oosteind komt vooral "Vrijstaande woningen" veel voor, met ongeveer 315 woningen.
View more homes in this location.
4909AH Oosteind
€ 389.000 k.k.
€ 4.322/m²
4909BA Oosteind
€ 550.000 k.k.
€ 4.104/m²
4909BS Oosteind
€ 469.000 k.k.
€ 3.326/m²

4909AZ Oosteind
€ 625.000 k.k.
€ 4.699/m²

4909BS Oosteind
€ 795.000 k.k.
€ 4.140/m²

4909AH Oosteind
€ 375.000 k.k.
€ 4.166/m²

4909AC Oosteind
€ 835.000 k.k.
€ 4.638/m²

4909AZ Oosteind
€ 769.000 k.k.
€ 0/m²

