Residents
11.140
Last year: 2026
6862CN Oosterbeek • Gelderland
€ 285.000 k.k.
Cost of copper (estimated): € 7.550
2% transfer tax (€ 5.700) + notary (€ 1.150) + valuation (€ 700)
Total incl. VAT: € 292.550
Purchase price /m²: € 5.588
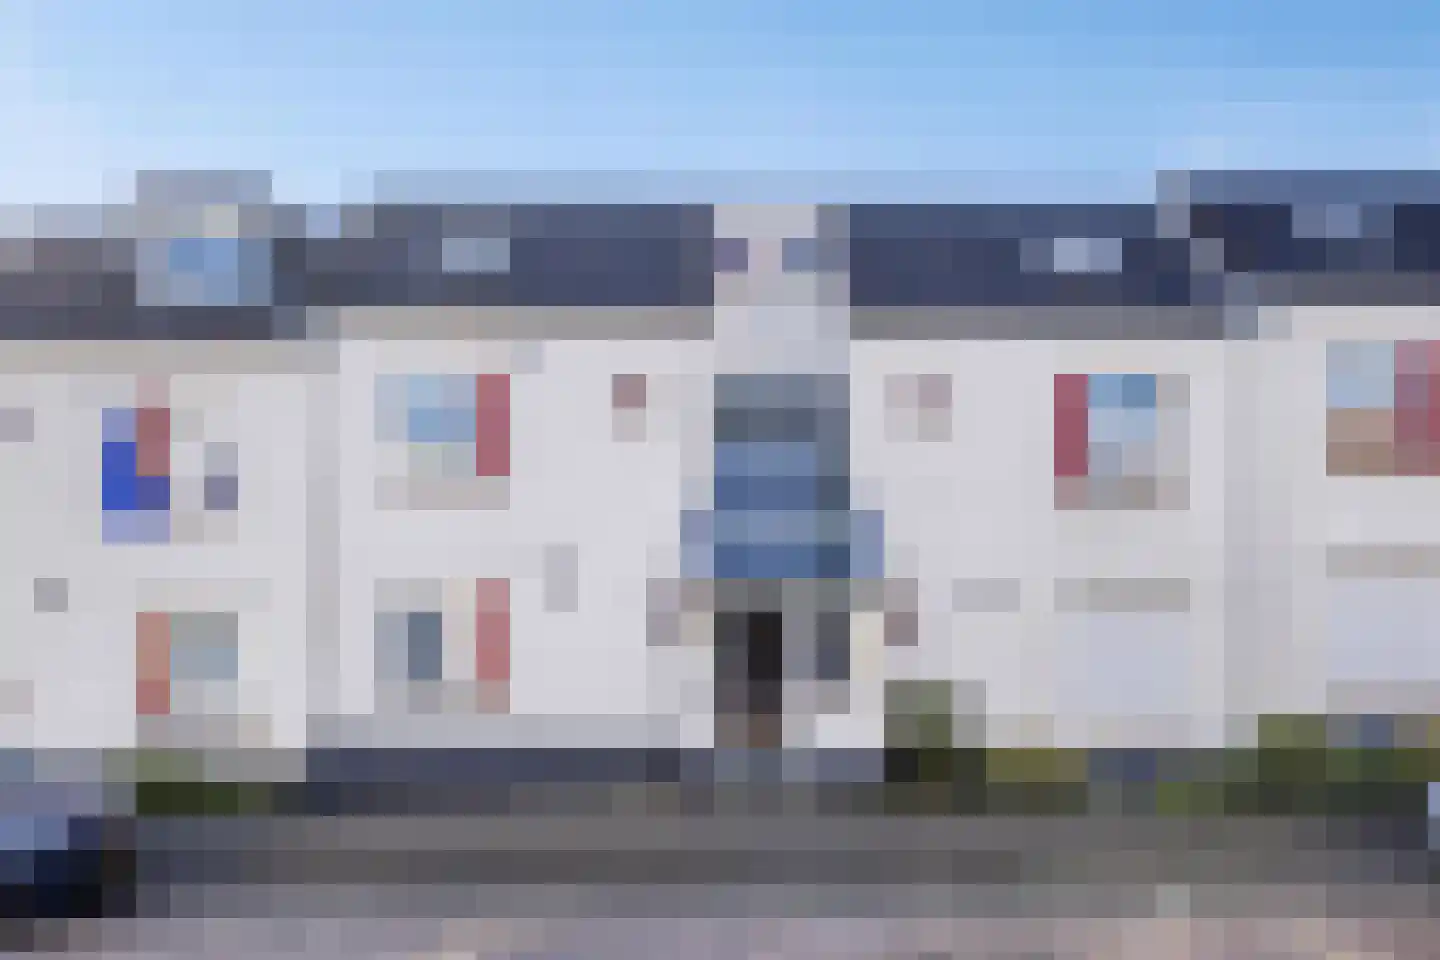
Modern en instapklaar appartement in het hart van Oosterbeek! Op zoek naar een comfortabel appartement met volop licht, een zonnig balkon én je eigen grote garage? Dit ruime 2-kamerappartement (energielabel C) biedt het allemaal! De woning ligt op een fantastische locatie: in het centrum van Oosterbeek met winkels, restaurants en voorzieningen om de hoek, terwijl de prachtige natuurgebieden in de directe omgeving zorgen voor rust en ontspanning. Naast de fijne ligging is dit appartement netjes onderhouden en eigentijds afgewerkt. Zowel de keuken als de badkamer zijn modern uitgevoerd, waardoor je hier direct kunt genieten zonder eerst te hoeven verbouwen. Pluspunten die je zeker niet mag missen: - Eigen garage met elektra en water, plus een extra berging en privéparkeerplaats voor de garage - Zonnig balkon op het zuiden met vrij uitzicht - Moderne keuken - Fraaie badkamer met inloopdouche en wastafelmeubel. - Veel comfort dankzij buitenzonwering (zonnescherm en rolluiken) - Actieve en gezonde VvE met een maandelijkse bijdrage van ca. € 149,-. Indeling Begane grond: Centrale entree met toegang tot het appartement. In de onderbouw bevinden zich de inpandige garage, de berging en de privéparkeerplaats. Indeling appartement: hal, modern hangend toilet, moderne, luxe keuken met diverse inbouwapparatuur en lichte woonkamer met schuifpui naar balkon. Dit zonnige balkon op het zuiden biedt een vrij uitzicht over het achtergelegen terrein. Wonen in Oosterbeek Dit appartement combineert het gemak van wonen in het centrum met de rust van een groene omgeving. Binnen enkele minuten sta je in de bossen of langs de Rijn, terwijl je dagelijks profiteert van alle voorzieningen (waaronder een basisschool en BSO) op loopafstand. Kortom: een ideaal appartement voor wie comfortabel, instapklaar en centraal wil wonen!
€ 285.000
Cost of copper (estimated): € 7.550
2% transfer tax (€ 5.700) + notary (€ 1.150) + valuation (€ 700)
Total purchase (incl. p.p.): € 292.550
3,02%
Yearly
€ 14.250
Direct available
Estimated mortgage
Indicative gross monthly cost
Based on annuity and 30 year term
Indicative net monthly cost
iDisclaimer: this mortgage calculation is a simplified indication based on general assumptions. No rights can be derived from the results shown. Calculated with 10-annual interest (met NHG), automatically determined based on the price limit € 470.000. Source: 10-jaars rente uit mortgage_rates (08-06-2026 03:45).
Dubbele wastafel, inloopdouche, en wastafelmeubel
Elektra en stromend water
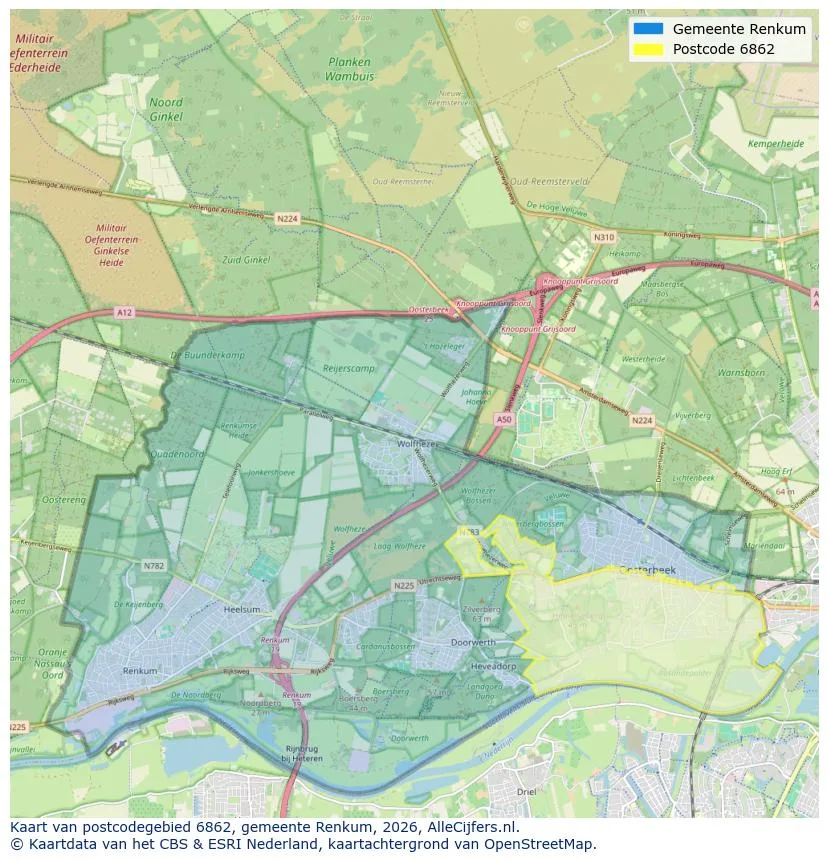
Discover where agents are active in Oosterbeek
View current location data on residents, WOZ development, housing stock, energy consumption, business activity and safety in Oosterbeek. In 2026 were there 11.140 residents. The average WOZ value in 2025 is EUR 527.735.
Residents
11.140
Last year: 2026
Average WOZ
EUR 527.735
Last year: 2025
Average income per person.
EUR 39.280
Source: AllNumbers
Crimes (current year)
346
Total registered
| Year | Residents |
|---|---|
| 2021 | 11.370 |
| 2022 | 11.395 |
| 2023 | 11.410 |
| 2024 | 11.235 |
| 2025 | 11.290 |
| 2026 | 11.140 |
| Year | Average WOZ |
|---|---|
| 2021 | EUR 382.998 |
| 2022 | EUR 411.493 |
| 2023 | EUR 480.586 |
| 2024 | EUR 494.039 |
| 2025 | EUR 527.735 |
Hoger
4.090
Praktisch
1.380
Middelbaar
2.170
Europa
860
Nederland
9.315
Buiten Europa
1.135
Label G
1.093
Label C
955
Label A
904
Label F
785
Label E
613
Label D
525
Label B
497
Label A+
49
Label A+++
30
Label A++
28
Label A++++
2
Label A+++++
0
| Year | Gas (m3) | Electricity (kWh) |
|---|---|---|
| 2020 | 1.559 | 2.958 |
| 2021 | 1.759 | 3.024 |
| 2022 | 1.370 | 2.835 |
| 2023 | 1.133 | 2.714 |
| 2024 | 1.110 | 2.785 |
Hoekwoning
Gas: 944 • Electricity: 2.187
Huurwoning
Gas: 773 • Electricity: 1.887
Koopwoning
Gas: 1.285 • Electricity: 3.084
Appartement
Gas: 700 • Electricity: 1.900
Tussenwoning
Gas: 829 • Electricity: 2.049
Vrijstaande woning
Gas: 1.783 • Electricity: 4.129
Twee-onder-één-kap woning
Gas: 1.231 • Electricity: 3.115
Total number of company establishments: 2.050
| Period | Crimes |
|---|---|
| jan 2026 | 25 |
| jul 2025 | 33 |
| jun 2025 | 38 |
| mei 2025 | 25 |
| mrt 2025 | 33 |
| mrt 2026 | 31 |
| nov 2024 | 24 |
| nov 2025 | 20 |
| okt 2024 | 64 |
| okt 2025 | 20 |
| sep 2024 | 40 |
| sep 2025 | 38 |
These figures give an indicative picture of safety trends in the living environment of Oosterbeek.
Short answers based on current local statistics, handy for a quick comparison of the living environment.
Oosterbeek telt in 2026 ongeveer 11.140 inwoners.
De gemiddelde WOZ-waarde in Oosterbeek is in 2025 circa € 527.735.
Het gemiddelde inkomen per inwoner in Oosterbeek ligt rond € 39.280 per jaar.
Voor het huidige jaar gaat het om ongeveer 346 geregistreerde misdrijven. Gebruik deze cijfers als indicatie en vergelijk trends per periode.
In Oosterbeek komt vooral "Appartementen" veel voor, met ongeveer 1.761 woningen.
View more homes in this location.

6861DB Oosterbeek
€ 595.000 k.k.
€ 5.312/m²

6861DD Oosterbeek
€ 350.000 k.k.
€ 4.118/m²

6861EE Oosterbeek
€ 898.000 k.k.
€ 4.216/m²

6861GJ Oosterbeek
€ 544.000 k.k.
€ 5.333/m²
6862XB Oosterbeek
€ 775.000 k.k.
€ 6.008/m²

6861ZJ Oosterbeek
€ 439.500 k.k.
€ 5.110/m²

6861AV Oosterbeek
€ 800.000 k.k.
€ 4.103/m²

6861AV Oosterbeek
€ 405.000 k.k.
€ 5.870/m²
