
Residents
964
Last year: 2025
8453XG Oranjewoud • Fryslân
€ 1.125.000 k.k.
Cost of copper (estimated): € 24.350
2% transfer tax (€ 22.500) + notary (€ 1.150) + valuation (€ 700)
Total incl. VAT: € 1.149.350
Purchase price /m²: € 5.184
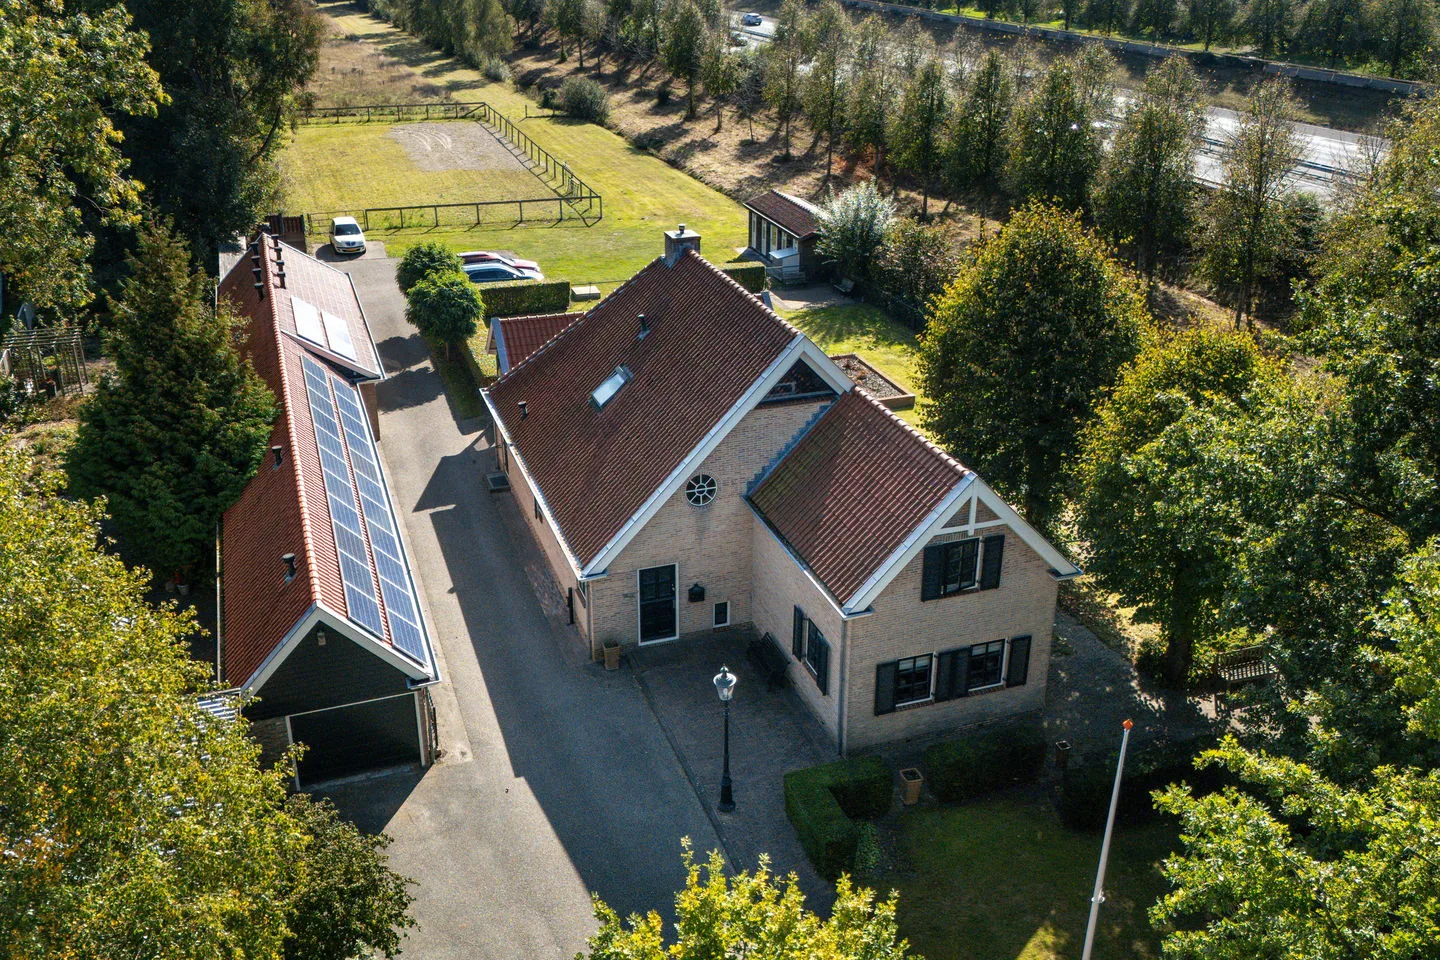
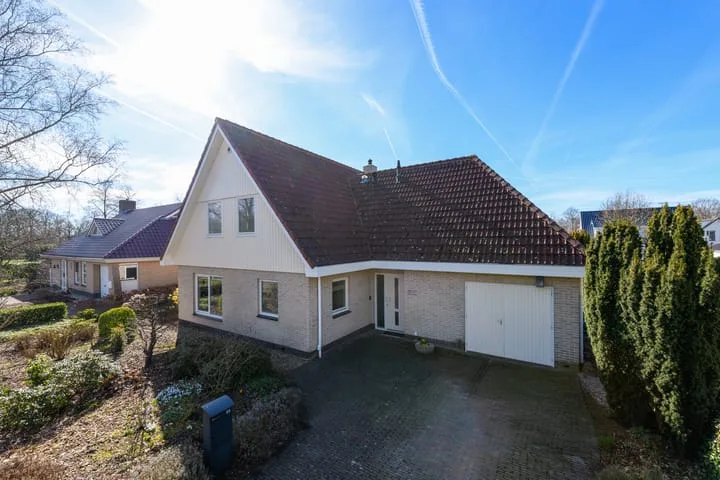
Heidelaan 41 in het rustieke Oranjewoud biedt een royale herenhuis woning uit 2003 met hoogwaardige afwerking. De ligging nabij bossen en met toegang tot goede voorzieningen is zeer gunstig, terwijl de A7 en A32 in de buurt zijn. De woonkamer biedt via openslaande deuren toegang tot het terras en de verzorgde tuin omringd door een beukenhaag voor privacy. Het aangepaste interieur met samengevoegde keuken-woonkamer ruimte heeft hoge apparatenstandaarden, inclusief kookeiland, stoomoven, en dubbele wastafel in de badkamer op de eerste verdieping. De tweede verdieping biedt extra slaapruimtes of hobbyruimtes en de vrijstaande garage kan als werkruimte dienen.
€ 1.125.000
Cost of copper (estimated): € 24.350
2% transfer tax (€ 22.500) + notary (€ 1.150) + valuation (€ 700)
Total purchase (incl. p.p.): € 1.149.350
3,04%
Yearly
€ 56.250
Direct available
Estimated mortgage
Indicative gross monthly cost
Based on annuity and 30 year term
Indicative net monthly cost
iDisclaimer: this mortgage calculation is a simplified indication based on general assumptions. No rights can be derived from the results shown. Calculated with 10-annual interest (zonder NHG), automatically determined based on the price limit € 470.000. Source: 10-jaars rente uit mortgage_rates (17-05-2026 03:45). For non-NHG, an 80% mortgage of the market value has been used in this indication.
Douche, dubbele wastafel, en ligbad
Vliering en verwarming
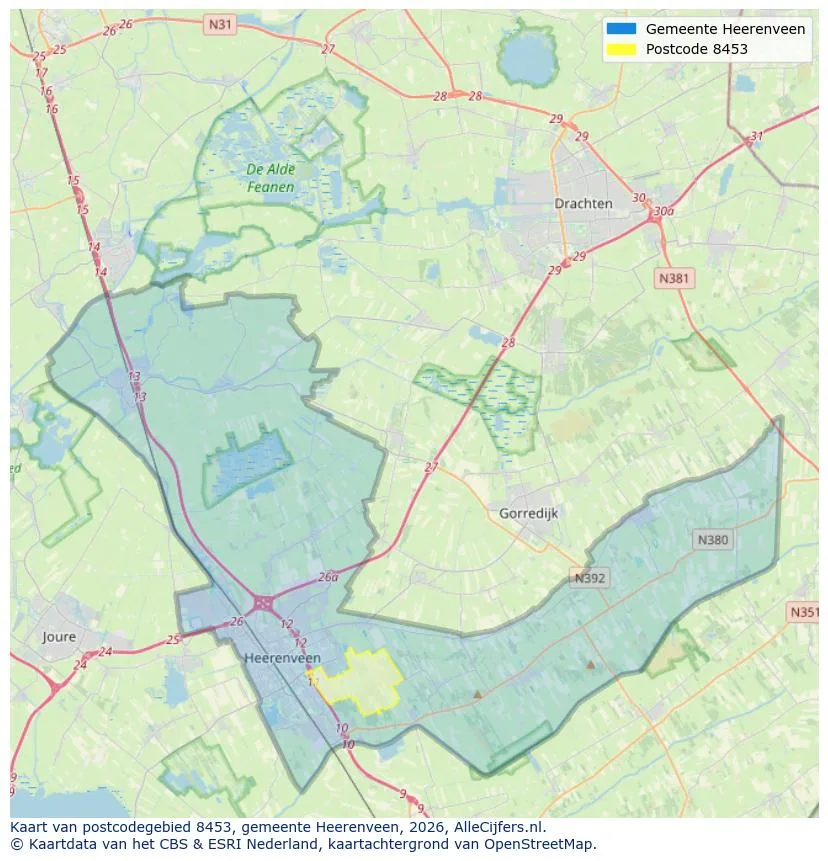
Explore Oranjewoud and the surrounding areas
View current location data on residents, WOZ development, housing stock, energy consumption, business activity and safety in Oranjewoud. In 2025 were there 964 residents. The average WOZ value in 2025 is EUR 542.000.
Residents
964
Last year: 2025
Average WOZ
EUR 542.000
Last year: 2025
Average income per person.
EUR 37.500
Source: AllNumbers
Crimes (current year)
13
Total registered
| Year | Residents |
|---|---|
| 2021 | 977 |
| 2022 | 974 |
| 2023 | 986 |
| 2024 | 961 |
| 2025 | 964 |
| Year | Average WOZ |
|---|---|
| 2021 | EUR 399.000 |
| 2022 | EUR 434.000 |
| 2023 | EUR 514.000 |
| 2024 | EUR 528.000 |
| 2025 | EUR 542.000 |
Hoger
304
Praktisch
128
Middelbaar
262
Europa
27
Nederland
876
Buiten Europa
61
Label G
99
Label B
92
Label A
83
Label F
50
Label C
36
Label D
36
Label E
17
Label A+
5
Label A++
2
Label A+++
2
Label A++++
1
Label A+++++
0
| Year | Gas (m3) | Electricity (kWh) |
|---|---|---|
| 2020 | 1.770 | 3.380 |
| 2021 | 1.990 | 3.490 |
| 2022 | 1.550 | 3.400 |
| 2023 | 1.260 | 3.210 |
| 2024 | 1.190 | 3.380 |
Hoekwoning
Gas: 770 • Electricity: 1.870
Huurwoning
Gas: 1.030 • Electricity: 2.260
Koopwoning
Gas: 1.300 • Electricity: 3.370
Appartement
Gas: 1.380 • Electricity: 3.310
Tussenwoning
Gas: 680 • Electricity: 1.960
Vrijstaande woning
Gas: 1.360 • Electricity: 3.480
Twee-onder-één-kap woning
Gas: 990 • Electricity: 2.320
Total number of company establishments: 149
| Period | Crimes |
|---|---|
| jan 2025 | 0 |
| jan 2026 | 0 |
| jul 2025 | 1 |
| jun 2025 | 0 |
| mei 2025 | 2 |
| mrt 2025 | 1 |
| nov 2024 | 1 |
| nov 2025 | 2 |
| okt 2024 | 3 |
| okt 2025 | 0 |
| sep 2024 | 3 |
| sep 2025 | 2 |
These figures give an indicative picture of safety trends in the living environment of Oranjewoud.
Short answers based on current local statistics, handy for a quick comparison of the living environment.
Oranjewoud telt in 2025 ongeveer 964 inwoners.
De gemiddelde WOZ-waarde in Oranjewoud is in 2025 circa € 542.000.
Het gemiddelde inkomen per inwoner in Oranjewoud ligt rond € 37.500 per jaar.
Voor het huidige jaar gaat het om ongeveer 13 geregistreerde misdrijven. Gebruik deze cijfers als indicatie en vergelijk trends per periode.
In Oranjewoud komt vooral "Vrijstaande woningen" veel voor, met ongeveer 388 woningen.
View more homes in this location.

8453XD Oranjewoud
€ 1.895.000 k.k.
€ 8.133/m²

8453WZ Oranjewoud
€ 595.000 k.k.
€ 6.010/m²
8453WC Oranjewoud
€ 1.250.000 k.k.
€ 4.902/m²
8453VE Oranjewoud
€ 675.000 k.k.
€ 4.141/m²

8453WC Oranjewoud
€ 675.000 k.k.
€ 3.924/m²

8453WC Oranjewoud
€ 445.000 k.k.
€ 3.739/m²

8453XD Oranjewoud
€ 575.000 k.k.
€ 4.356/m²

8453VA Oranjewoud
€ 1.050.000 k.k.
€ 3.750/m²
