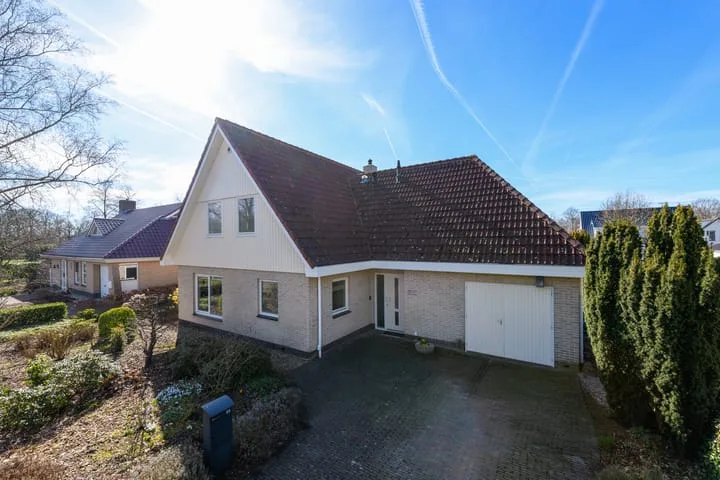
Houses sold in Oranjewoud

View 10 sold houses in Oranjewoud

Connected to: Vastgoed Nederland NVM Makelaars

On this page you will find recently sold homes in Oranjewoud. Use this overview to better estimate selling prices, popular neighborhoods, and the local housing supply before you choose a real estate agent. Also view the current housing supply with 14 houses in Oranjewoud.

Selection

Search and filter homes

Set your preferences and discover homes that suit you.

Total supply 241.263
Filters

Set price, area and other characteristics. Adjust a filter or click on Show homes. Location changes directly above.

Reset filters

You search for

  • Place Oranjewoud
  • Status Sold

Huis verkopen in Oranjewoud? Vergelijk verkoopmakelaars

Bekijk recente verkopen en ontvang gratis offertes van lokale verkoopmakelaars in Oranjewoud.

Free request a quote

  • Quotes in Oranjewoud
  • Non-binding
  • Personal
  • Gratis tarieven vergelijken

Zelf je woning verkopen in Oranjewoud? Vergelijk verkoopmakelaars in Oranjewoud of bekijk de beste verkoopmakelaars in Oranjewoud als referentie bij jouw keuze.

Vergelijk meerdere offertes

Makelaars maken scherpere voorstellen als ze weten dat je vergelijkt — vraag offertes aan voor verkoop of aankoop.

Frequently asked questions about sold homes in Oranjewoud

Short answers about housing prices, sold homes and comparing real estate agents in Oranjewoud.

Residential and neighborhood statistics in Oranjewoud

View current location data on residents, WOZ development, housing stock, energy consumption, business activity and safety in Oranjewoud. In 2025 were there 964 residents. The average WOZ value in 2025 is EUR 542.000.

These figures help to better assess and compare the housing stock in Oranjewoud with recent sold homes. Orient yourself then on suitable top real estate agents in Oranjewoud for sales advice in this region.

Residents

964

Last year: 2025

Average WOZ

EUR 542.000

Last year: 2025

Average income per person.

EUR 37.500

Source: AllNumbers

Crimes (current year)

13

Total registered

Demographics and WOZ development

Inhabitants per year

Inhabitants per year in Oranjewoud
Year Residents
2021 977
2022 974
2023 986
2024 961
2025 964

Annual WOZ value

WOZ value per year in Oranjewoud
Year Average WOZ
2021 EUR 399.000
2022 EUR 434.000
2023 EUR 514.000
2024 EUR 528.000
2025 EUR 542.000

Composition of residents

Age build-up

65+: 243 0-15: 149 15-25: 97 25-45: 161 45-65: 307

Education level

Hoger

304

Praktisch

128

Middelbaar

262

Origin of residents (2025)

Europa

27

Nederland

876

Buiten Europa

61

Housing stock and construction periods

Types of homes

Hoekwoningen 1
Appartementen 4
Tussenwoningen 1
Vrijstaande woningen 388
Twee-onder-één-kap woningen 30

Construction period of buildings

Voor 1700 0
1700 tot 1900 40
1900 tot 1925 29
1925 tot 1950 74
1950 tot 1970 90
1970 tot 1980 13
1980 tot 1990 16
1990 tot 2000 100
2000 tot 2010 42
2010 tot 2020 19
2020 en later 11

Energy and sustainability

Energy label distribution

Label G

99

Label B

92

Label A

83

Label F

50

Label C

36

Label D

36

Label E

17

Label A+

5

Label A++

2

Label A+++

2

Label A++++

1

Label A+++++

0

Average energy consumption per year

Average energy consumption per year in Oranjewoud
Year Gas (m3) Electricity (kWh)
2020 1.770 3.380
2021 1.990 3.490
2022 1.550 3.400
2023 1.260 3.210
2024 1.190 3.380

Consumption per house type

Hoekwoning

Gas: 770 • Electricity: 1.870

Huurwoning

Gas: 1.030 • Electricity: 2.260

Koopwoning

Gas: 1.300 • Electricity: 3.370

Appartement

Gas: 1.380 • Electricity: 3.310

Tussenwoning

Gas: 680 • Electricity: 1.960

Vrijstaande woning

Gas: 1.360 • Electricity: 3.480

Twee-onder-één-kap woning

Gas: 990 • Electricity: 2.320

Business activity in Oranjewoud (2025)

Handel en HORECA 15
Nijverheid en energie 15
Zakelijke dienstverlening 52
Overheid, onderwijs en zorg 27
Landbouw, bosbouw en visserij 3
Vervoer, informatie en communicatie 9
Financiele diensten en onroerendgoed 15
Cultuur, recreatie en overige diensten 15

Total number of company establishments: 149

Recent crime statistics

Recent crime statistics in Oranjewoud
Period Crimes
jan 2025 0
jan 2026 0
jul 2025 1
jun 2025 0
mei 2025 2
mrt 2025 1
nov 2024 1
nov 2025 2
okt 2024 3
okt 2025 0
sep 2024 3
sep 2025 2

These figures give an indicative picture of safety trends in the living environment of Oranjewoud.

Frequently asked questions about living in Oranjewoud

Short answers based on current local statistics, handy for a quick comparison of the living environment.

Hoeveel inwoners heeft Oranjewoud?

Oranjewoud telt in 2025 ongeveer 964 inwoners.

Wat is de gemiddelde WOZ-waarde in Oranjewoud?

De gemiddelde WOZ-waarde in Oranjewoud is in 2025 circa € 542.000.

Wat is het gemiddelde inkomen per inwoner in Oranjewoud?

Het gemiddelde inkomen per inwoner in Oranjewoud ligt rond € 37.500 per jaar.

Hoe veilig is wonen in Oranjewoud?

Voor het huidige jaar gaat het om ongeveer 13 geregistreerde misdrijven. Gebruik deze cijfers als indicatie en vergelijk trends per periode.

Welke woningtypen komen het meest voor in Oranjewoud?

In Oranjewoud komt vooral "Vrijstaande woningen" veel voor, met ongeveer 388 woningen.

Gratis vrijblijvende offertes ontvangen

Vergelijk meerdere makelaars en kies de beste match.