
Residents
30.410
Last year: 2025
2642LJ Pijnacker • Zuid-Holland
€ 375.000 k.k.
Cost of copper (estimated): € 9.350
2% transfer tax (€ 7.500) + notary (€ 1.150) + valuation (€ 700)
Total incl. VAT: € 384.350
For this property, no detailed description is available yet.
€ 375.000
Cost of copper (estimated): € 9.350
2% transfer tax (€ 7.500) + notary (€ 1.150) + valuation (€ 700)
Total purchase (incl. p.p.): € 384.350
2,78%
Yearly
€ 18.750
Direct available
Estimated mortgage
Indicative gross monthly cost
Based on annuity and 30 year term
Indicative net monthly cost
iDisclaimer: this mortgage calculation is a simplified indication based on general assumptions. No rights can be derived from the results shown. Calculated with 10-annual interest (met NHG), automatically determined based on the price limit € 470.000. Source: 10-jaars rente uit mortgage_rates (23-04-2026 08:38).
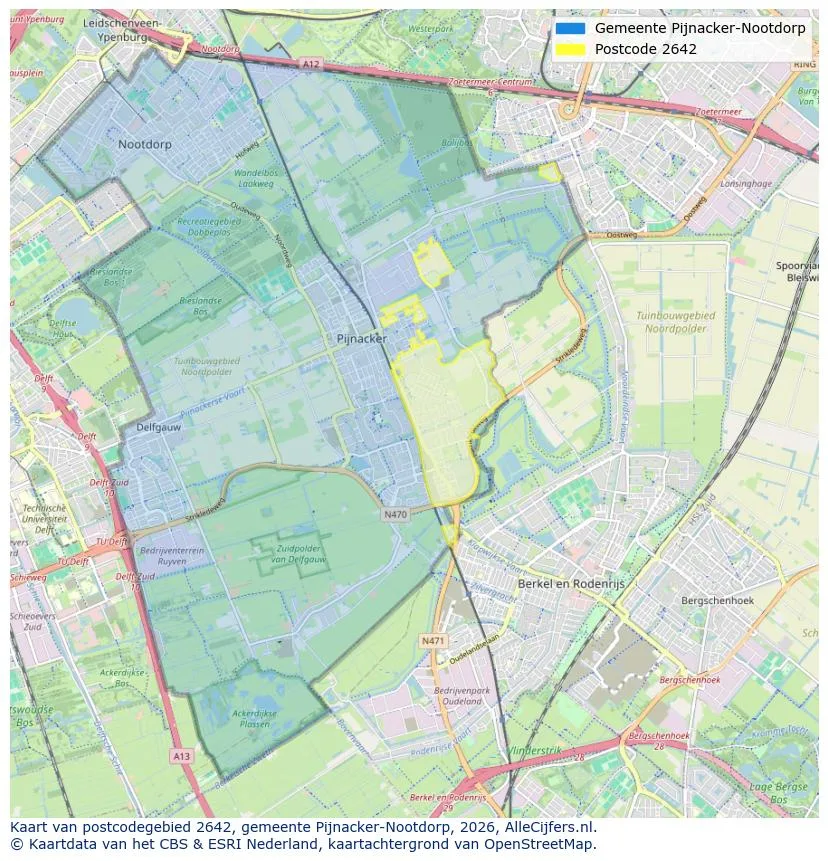
Spatial overview of the work area in Pijnacker
View current location data on residents, WOZ development, housing stock, energy consumption, business activity and safety in Pijnacker. In 2025 were there 30.410 residents. The average WOZ value in 2025 is EUR 516.000.
Residents
30.410
Last year: 2025
Average WOZ
EUR 516.000
Last year: 2025
Average income per person.
EUR 38.500
Source: AllNumbers
Crimes (current year)
936
Total registered
| Year | Residents |
|---|---|
| 2021 | 27.580 |
| 2022 | 28.470 |
| 2023 | 29.605 |
| 2024 | 29.995 |
| 2025 | 30.410 |
| Year | Average WOZ |
|---|---|
| 2021 | EUR 344.000 |
| 2022 | EUR 389.000 |
| 2023 | EUR 466.000 |
| 2024 | EUR 491.000 |
| 2025 | EUR 516.000 |
Hoger
9.130
Praktisch
4.580
Middelbaar
8.230
Europa
1.985
Nederland
23.065
Buiten Europa
5.360
Label A
4.509
Label C
2.576
Label B
1.828
Label A+++
1.045
Label D
605
Label E
494
Label A+
461
Label G
424
Label F
410
Label A++
360
Label A++++
94
Label A+++++
2
| Year | Gas (m3) | Electricity (kWh) |
|---|---|---|
| 2020 | 1.050 | 2.940 |
| 2021 | 1.120 | 3.040 |
| 2022 | 830 | 2.880 |
| 2023 | 710 | 2.750 |
| 2024 | 680 | 2.800 |
Hoekwoning
Gas: 840 • Electricity: 2.850
Huurwoning
Gas: 510 • Electricity: 2.250
Koopwoning
Gas: 790 • Electricity: 2.940
Appartement
Gas: 390 • Electricity: 1.920
Tussenwoning
Gas: 710 • Electricity: 2.700
Vrijstaande woning
Gas: 1.150 • Electricity: 4.310
Twee-onder-één-kap woning
Gas: 860 • Electricity: 3.700
Total number of company establishments: 3.710
| Period | Crimes |
|---|---|
| jan 2025 | 65 |
| jan 2026 | 69 |
| jul 2025 | 86 |
| jun 2025 | 80 |
| mei 2025 | 80 |
| mrt 2025 | 88 |
| nov 2024 | 51 |
| nov 2025 | 76 |
| okt 2024 | 66 |
| okt 2025 | 80 |
| sep 2024 | 70 |
| sep 2025 | 80 |
These figures give an indicative picture of safety trends in the living environment of Pijnacker.
Short answers based on current local statistics, handy for a quick comparison of the living environment.
Pijnacker telt in 2025 ongeveer 30.410 inwoners.
De gemiddelde WOZ-waarde in Pijnacker is in 2025 circa € 516.000.
Het gemiddelde inkomen per inwoner in Pijnacker ligt rond € 38.500 per jaar.
Voor het huidige jaar gaat het om ongeveer 936 geregistreerde misdrijven. Gebruik deze cijfers als indicatie en vergelijk trends per periode.
In Pijnacker komt vooral "Tussenwoningen" veel voor, met ongeveer 5.484 woningen.
View more homes in this location.

2642JS Pijnacker
€ 895.000 k.k.
2641XN Pijnacker
€ 399.000 k.k.
€ 4.586/m²

2643NJ Pijnacker
€ 775.000 k.k.

2641GR Pijnacker
€ 550.000 k.k.

2642LJ Pijnacker
€ 385.000 k.k.
2641ZX Pijnacker
€ 915.000 k.k.
2642DV Pijnacker
€ 750.000 k.k.

2642CN Pijnacker
€ 598.000 k.k.
