
Residents
1.473
Last year: 2026
6655AE Puiflijk • Gelderland
For this property, no detailed description is available yet.
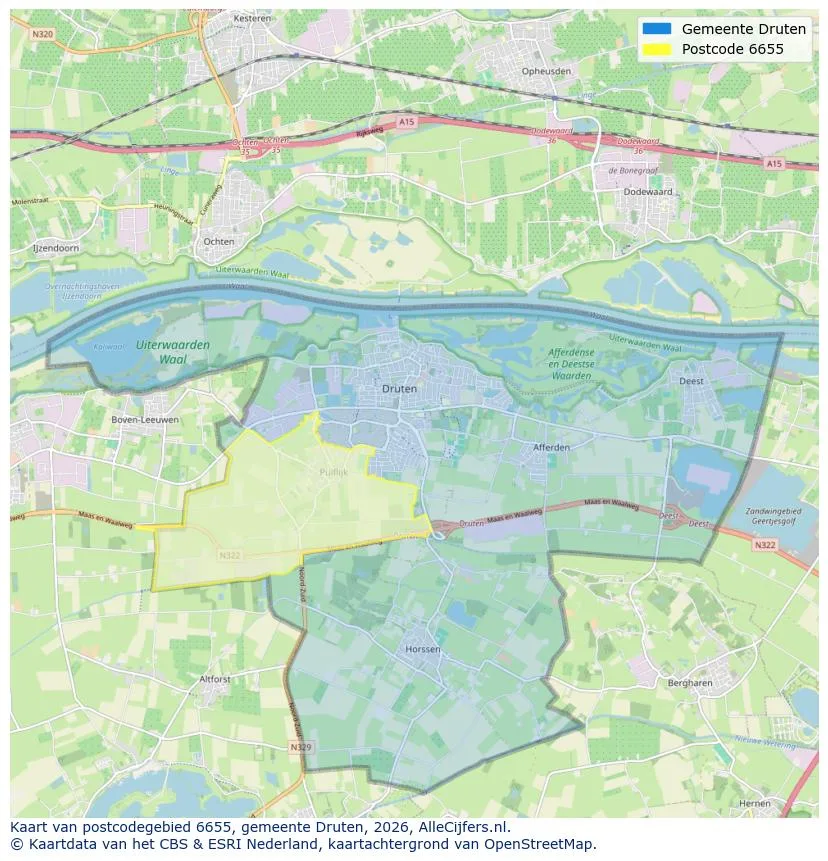
Explore Puiflijk and the surrounding areas
View current location data on residents, WOZ development, housing stock, energy consumption, business activity and safety in Puiflijk. In 2026 were there 1.473 residents. The average WOZ value in 2025 is EUR 444.000.
Residents
1.473
Last year: 2026
Average WOZ
EUR 444.000
Last year: 2025
Average income per person.
EUR 34.700
Source: AllNumbers
Crimes (current year)
38
Total registered
| Year | Residents |
|---|---|
| 2021 | 1.295 |
| 2022 | 1.300 |
| 2023 | 1.310 |
| 2024 | 1.315 |
| 2025 | 1.460 |
| 2026 | 1.473 |
| Year | Average WOZ |
|---|---|
| 2021 | EUR 314.000 |
| 2022 | EUR 351.000 |
| 2023 | EUR 387.000 |
| 2024 | EUR 409.000 |
| 2025 | EUR 444.000 |
Hoger
380
Praktisch
240
Middelbaar
530
Europa
65
Nederland
1.270
Buiten Europa
125
Label C
158
Label A
113
Label B
94
Label D
66
Label A+++
66
Label G
53
Label F
37
Label E
17
Label A+
4
Label A++
4
Label A++++
4
Label A+++++
0
| Year | Gas (m3) | Electricity (kWh) |
|---|---|---|
| 2020 | 1.480 | 3.530 |
| 2021 | 1.670 | 3.590 |
| 2022 | 1.280 | 3.360 |
| 2023 | 1.010 | 3.300 |
| 2024 | 980 | 3.410 |
Hoekwoning
Gas: 850 • Electricity: 2.710
Huurwoning
Gas: 750 • Electricity: 2.090
Koopwoning
Gas: 1.080 • Electricity: 3.650
Appartement
Gas: 690 • Electricity: 2.270
Tussenwoning
Gas: 800 • Electricity: 2.230
Vrijstaande woning
Gas: 1.170 • Electricity: 3.890
Twee-onder-één-kap woning
Gas: 980 • Electricity: 3.360
Total number of company establishments: 200
| Period | Crimes |
|---|---|
| jan 2026 | 1 |
| jul 2025 | 0 |
| jun 2025 | 0 |
| mei 2025 | 2 |
| mrt 2025 | 8 |
| mrt 2026 | 2 |
| nov 2024 | 2 |
| nov 2025 | 2 |
| okt 2024 | 2 |
| okt 2025 | 7 |
| sep 2024 | 1 |
| sep 2025 | 2 |
These figures give an indicative picture of safety trends in the living environment of Puiflijk.
Short answers based on current local statistics, handy for a quick comparison of the living environment.
Puiflijk telt in 2026 ongeveer 1.473 inwoners.
De gemiddelde WOZ-waarde in Puiflijk is in 2025 circa € 444.000.
Het gemiddelde inkomen per inwoner in Puiflijk ligt rond € 34.700 per jaar.
Voor het huidige jaar gaat het om ongeveer 38 geregistreerde misdrijven. Gebruik deze cijfers als indicatie en vergelijk trends per periode.
In Puiflijk komt vooral "Vrijstaande woningen" veel voor, met ongeveer 281 woningen.
View more homes in this location.

6655KE Puiflijk
€ 689.000 k.k.
€ 5.648/m²

6655AH Puiflijk
€ 395.000 k.k.
€ 3.911/m²

6655CA Puiflijk
€ 629.000 k.k.
€ 3.678/m²

6655AS Puiflijk
€ 710.000 k.k.
€ 3.989/m²

6655AE Puiflijk
€ 335.000 k.k.
€ 3.102/m²

6655AV Puiflijk
€ 385.000 k.k.
€ 3.438/m²

6655AH Puiflijk
€ 265.000 k.k.
€ 3.955/m²

6655AA Puiflijk
€ 675.000 k.k.
€ 3.609/m²
