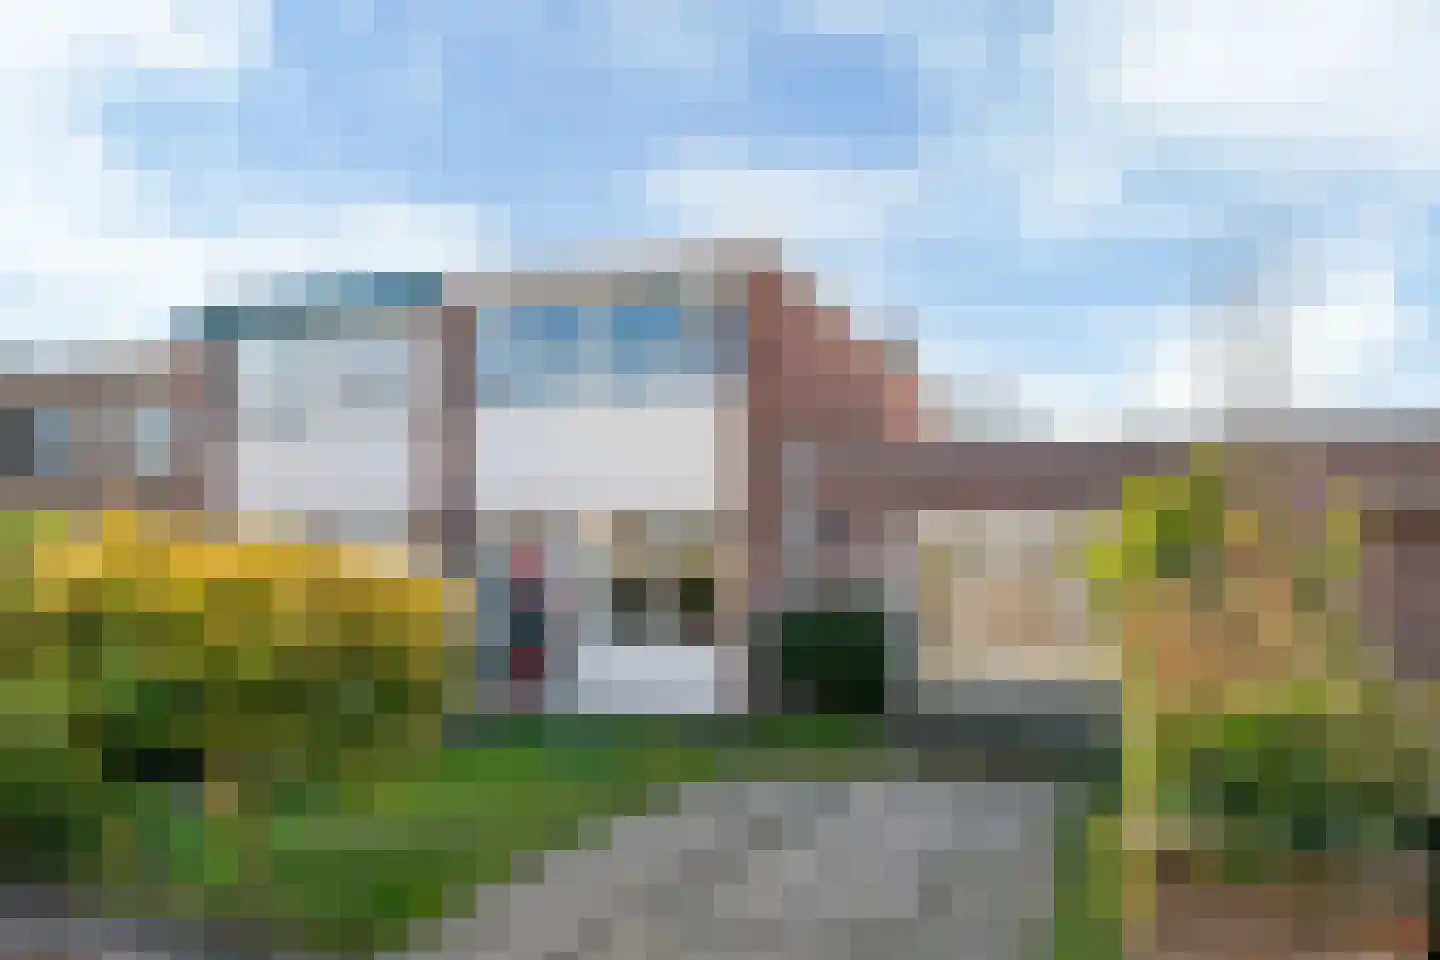
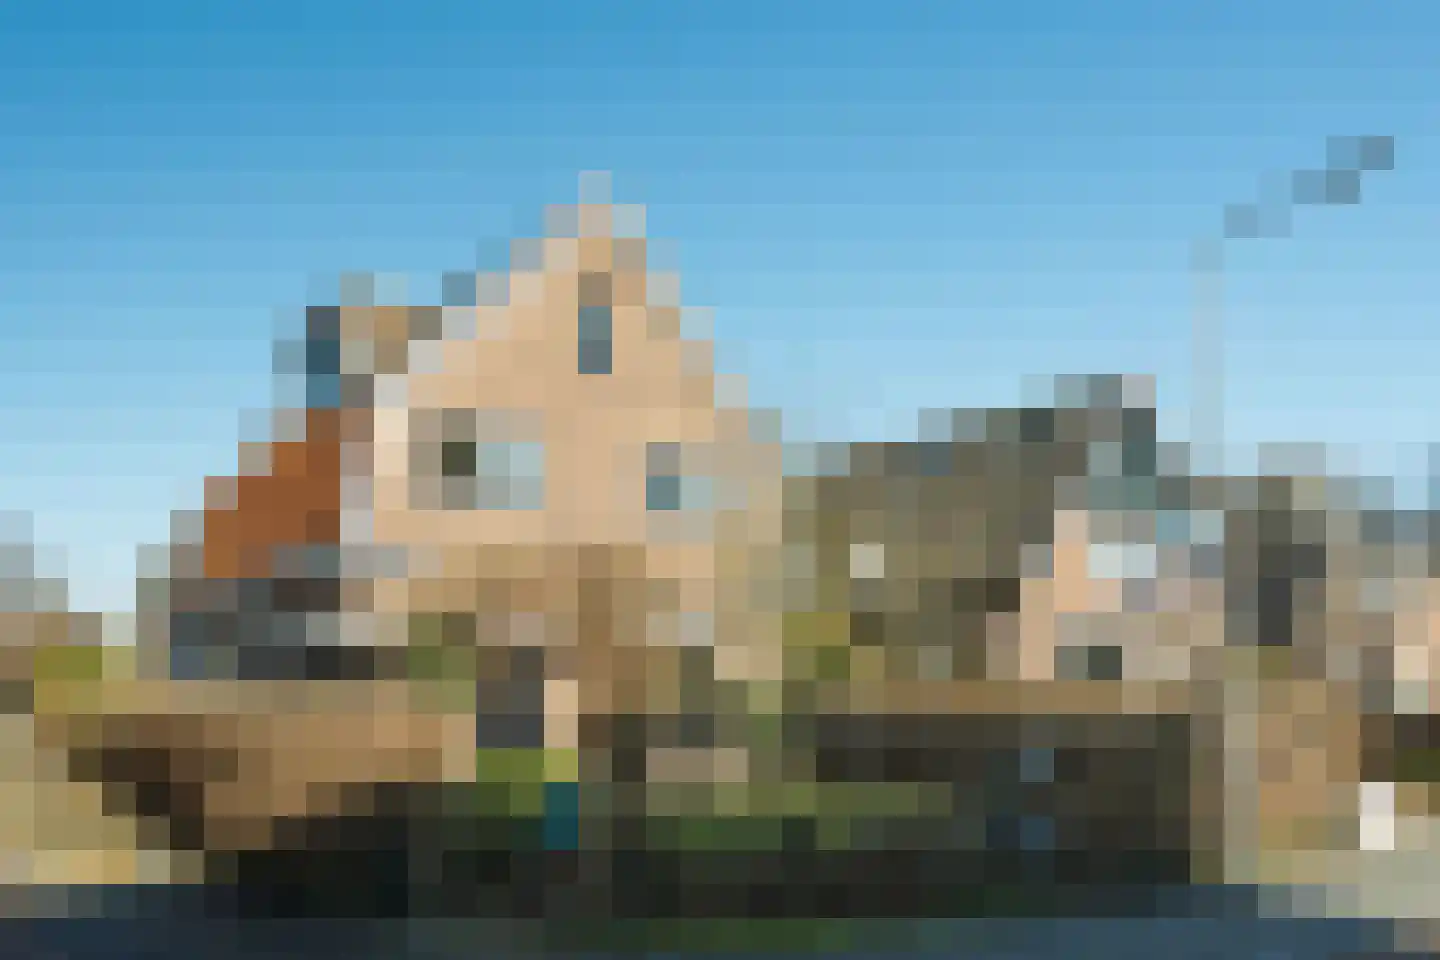
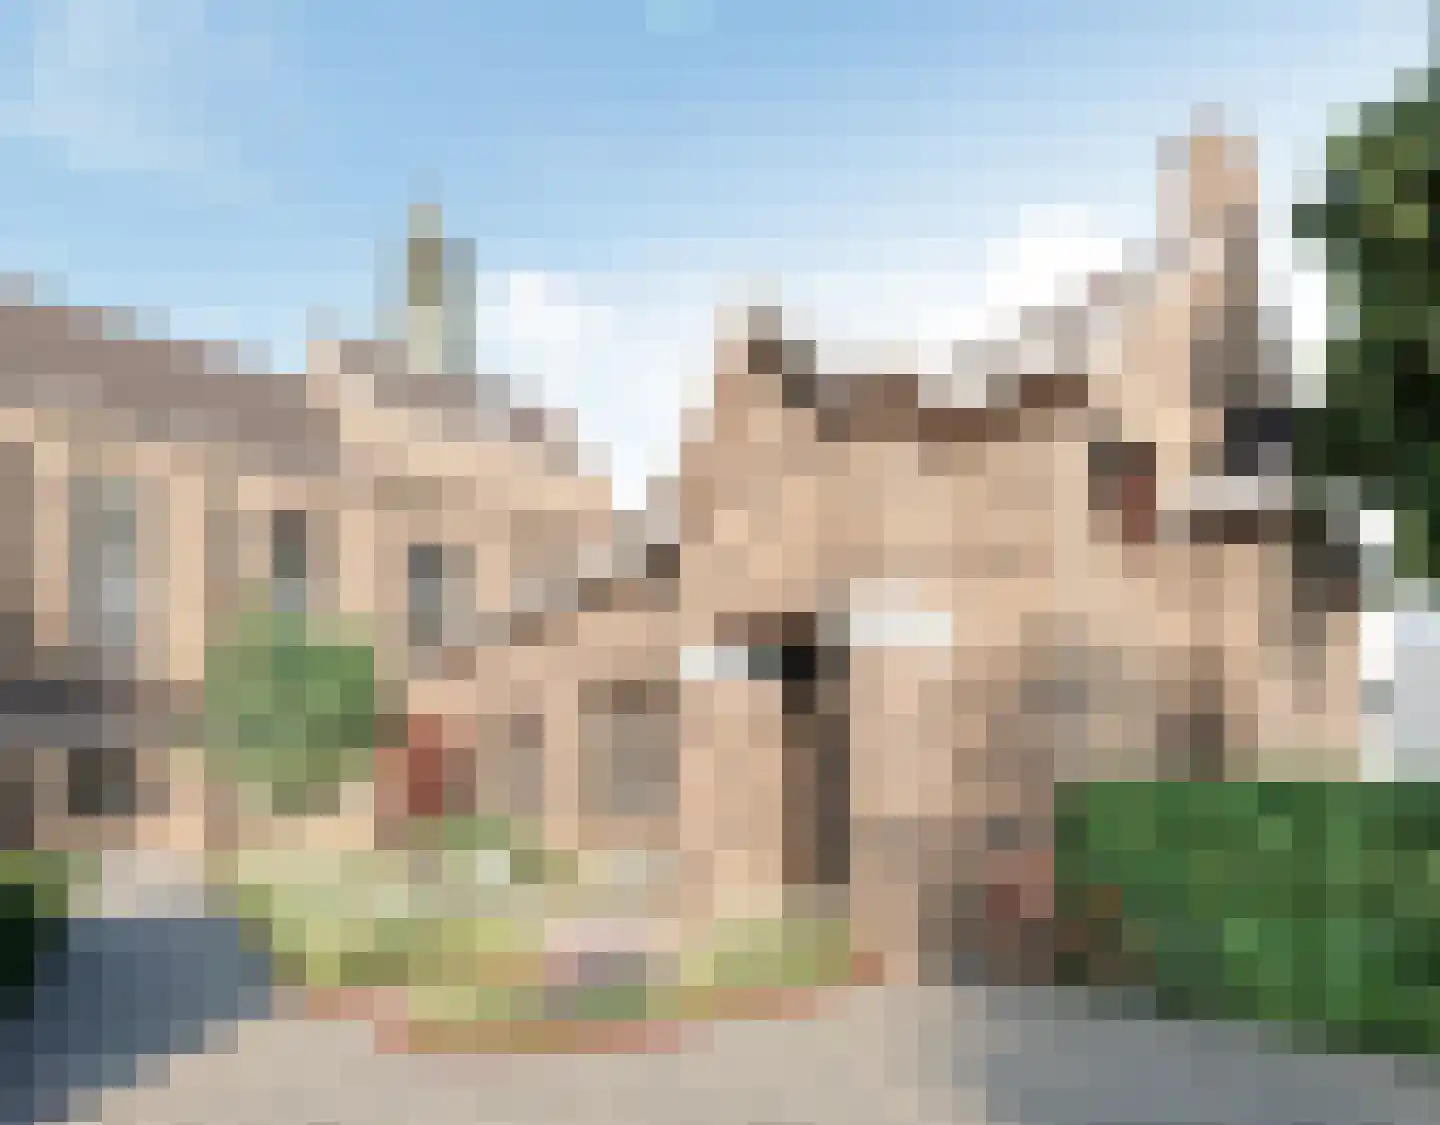
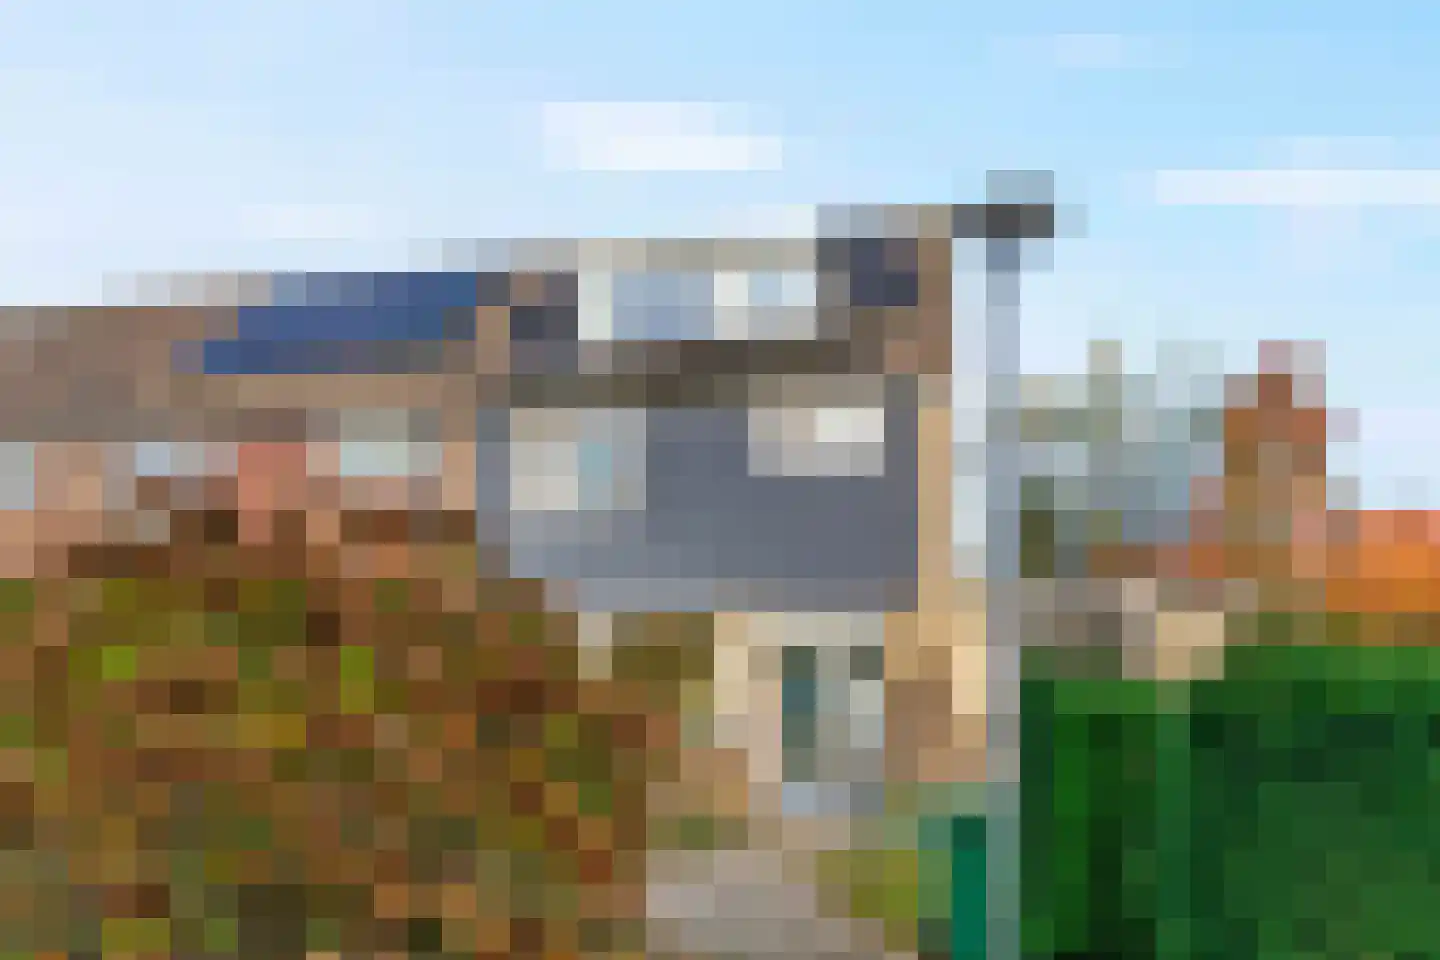
- Sold
Reijmerweg 25
6871HA Renkum
€ 485.000 k.k.
€ 3.880/m²
- Living area
- 125 m²
- Land area
- 374 m²
- Bedrooms
- 4
View 73 sold houses in Renkum
Type to search. Use arrow down and arrow up to navigate through results and press Enter to open.
Hidden search suggestions.
Compare sold homes in Renkum or view the current offering in this location directly.
On this page you will find recently sold homes in Renkum. Use this overview to better estimate selling prices, popular neighborhoods, and the local housing supply before you choose a real estate agent. Also view the current housing supply with 114 houses in Renkum.
6871HA Renkum
€ 485.000 k.k.
€ 3.880/m²
6871CN Renkum
€ 465.000 k.k.
€ 5.167/m²
6871LT Renkum
€ 415.000 k.k.
€ 4.662/m²
6871EG Renkum
€ 800.000 k.k.
€ 3.921/m²
6871WD Renkum
€ 499.000 k.k.
€ 3.960/m²
6871KS Renkum
€ 385.000 k.k.
€ 3.056/m²
6871GA Renkum
€ 449.000 k.k.
€ 4.317/m²
6871BD Renkum
€ 289.000 k.k.
€ 2.919/m²
6871CN Renkum
€ 595.000 k.k.
€ 5.950/m²
6871EH Renkum
€ 498.000 k.k.
€ 4.446/m²
6871AE Renkum
€ 275.000 k.k.
€ 3.928/m²
6871TJ Renkum
€ 530.000 k.k.
€ 4.344/m²
6871JB Renkum
€ 439.000 k.k.
€ 3.990/m²
6871JX Renkum
€ 425.000 k.k.
€ 3.971/m²
6871ZC Renkum
€ 495.000 k.k.
€ 3.639/m²
6871KS Renkum
€ 379.500 k.k.
€ 3.994/m²
6871BA Renkum
€ 496.500
€ 4.433/m²
6871BA Renkum
€ 534.500
€ 4.689/m²
6871JX Renkum
€ 895.000 k.k.
€ 6.438/m²
6871GL Renkum
€ 499.000 k.k.
€ 3.138/m²
6871XN Renkum
€ 375.000 k.k.
€ 4.464/m²
6871DW Renkum
€ 850.000 k.k.
€ 4.857/m²
6871WC Renkum
€ 419.000 k.k.
€ 3.675/m²
6871LR Renkum
€ 435.000 k.k.
€ 3.480/m²
6871HA Renkum
€ 199.500 k.k.
€ 4.534/m²
6871AE Renkum
€ 285.000 k.k.
€ 3.518/m²
6871HL Renkum
€ 389.500 k.k.
€ 4.529/m²
6871ER Renkum
€ 515.000 k.k.
€ 4.904/m²
Bekijk recente verkopen en ontvang gratis offertes van lokale verkoopmakelaars in Renkum.
Zelf je woning verkopen in Renkum? Vergelijk verkoopmakelaars in Renkum of bekijk de beste verkoopmakelaars in Renkum als referentie bij jouw keuze.
Makelaars maken scherpere voorstellen als ze weten dat je vergelijkt — vraag offertes aan voor verkoop of aankoop.
Short answers about housing prices, sold homes and comparing real estate agents in Renkum.
The costs of a real estate agent in Renkum vary per office, property type and sales approach. Therefore, compare multiple quotes and also look at the real estate agents in Renkum to better compare rates, presentation and local experience.
On this page we currently show 73 sold houses in Renkum from our selection. This helps you to better assess recent transactions and the local housing market.
Houses sold in Renkum give insight into asking prices, house types and neighborhoods where recent transactions have taken place. Compare this also with the current housing stock in Renkum to better understand the market.
You can use sold homes as a first market indication, but a local real estate agent can better take into account finishing, location, maintenance and current demand in Renkum.
Vergelijk makelaars in Renkum op lokale verkoopervaring, reviews, verwachte opbrengst, courtage en marketingaanpak. Bekijk verkoopmakelaars in Renkum of de top 10 makelaars in Renkum om snel sterke kantoren te ontdekken.
View current location data on residents, WOZ development, housing stock, energy consumption, business activity and safety in Renkum. In 2026 were there 9.105 residents. The average WOZ value in 2025 is EUR 376.869.
These figures help to better assess and compare the housing stock in Renkum with recent sold homes. Orient yourself then on suitable top real estate agents in Renkum for sales advice in this region.
Residents
9.105
Last year: 2026
Average WOZ
EUR 376.869
Last year: 2025
Average income per person.
EUR 34.517
Source: AllNumbers
Crimes (current year)
220
Total registered
| Year | Residents |
|---|---|
| 2021 | 9.100 |
| 2022 | 9.075 |
| 2023 | 9.195 |
| 2024 | 9.125 |
| 2025 | 9.110 |
| 2026 | 9.105 |
| Year | Average WOZ |
|---|---|
| 2021 | EUR 260.791 |
| 2022 | EUR 280.203 |
| 2023 | EUR 338.960 |
| 2024 | EUR 351.592 |
| 2025 | EUR 376.869 |
Hoger
2.510
Praktisch
1.520
Middelbaar
2.850
Europa
535
Nederland
7.555
Buiten Europa
1.015
Label C
1.199
Label A
754
Label G
538
Label D
449
Label B
424
Label F
371
Label E
344
Label A+
47
Label A+++
38
Label A++++
11
Label A++
8
Label A+++++
0
| Year | Gas (m3) | Electricity (kWh) |
|---|---|---|
| 2020 | 1.319 | 2.802 |
| 2021 | 1.485 | 2.851 |
| 2022 | 1.162 | 2.665 |
| 2023 | 976 | 2.512 |
| 2024 | 966 | 2.612 |
Hoekwoning
Gas: 968 • Electricity: 2.385
Huurwoning
Gas: 841 • Electricity: 1.958
Koopwoning
Gas: 1.055 • Electricity: 2.840
Appartement
Gas: 747 • Electricity: 1.845
Tussenwoning
Gas: 851 • Electricity: 2.336
Vrijstaande woning
Gas: 1.384 • Electricity: 3.581
Twee-onder-één-kap woning
Gas: 1.072 • Electricity: 2.766
Total number of company establishments: 1.070
| Period | Crimes |
|---|---|
| jan 2026 | 14 |
| jul 2025 | 18 |
| jun 2025 | 16 |
| mei 2025 | 18 |
| mrt 2025 | 39 |
| mrt 2026 | 16 |
| nov 2024 | 22 |
| nov 2025 | 18 |
| okt 2024 | 25 |
| okt 2025 | 17 |
| sep 2024 | 22 |
| sep 2025 | 12 |
These figures give an indicative picture of safety trends in the living environment of Renkum.
Short answers based on current local statistics, handy for a quick comparison of the living environment.
Renkum telt in 2026 ongeveer 9.105 inwoners.
De gemiddelde WOZ-waarde in Renkum is in 2025 circa € 376.869.
Het gemiddelde inkomen per inwoner in Renkum ligt rond € 34.517 per jaar.
Voor het huidige jaar gaat het om ongeveer 220 geregistreerde misdrijven. Gebruik deze cijfers als indicatie en vergelijk trends per periode.
In Renkum komt vooral "Tussenwoningen" veel voor, met ongeveer 1.121 woningen.