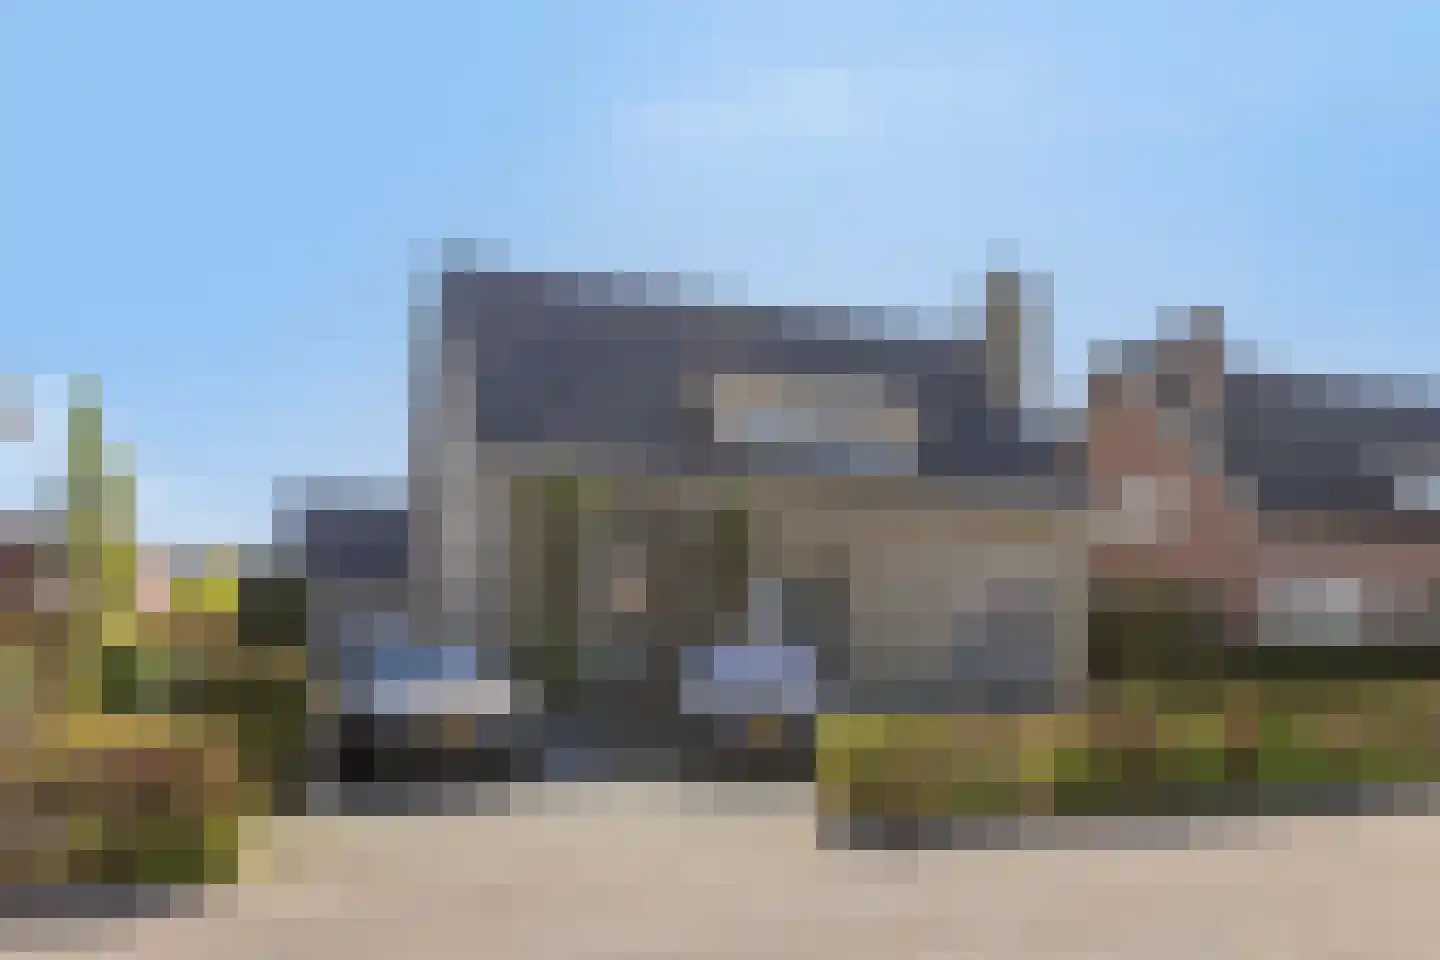
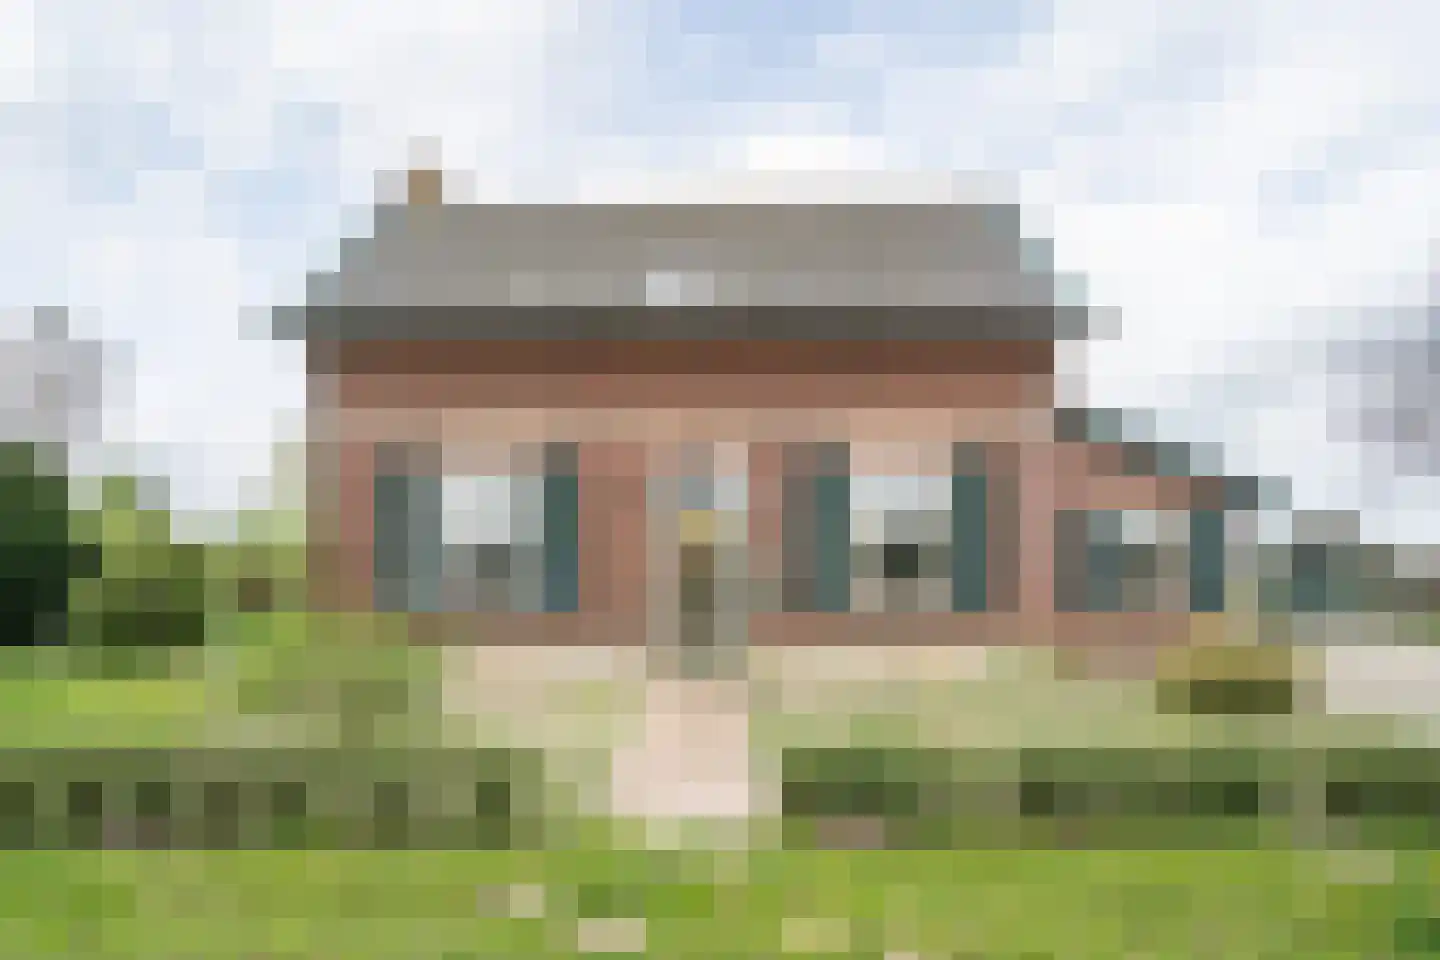
Housing offer in Rijkevoort

Searching in 17 houses in Rijkevoort

Connected to: Vastgoed Nederland NVM Makelaars

View the current housing stock in Rijkevoort and quickly filter by price, living area, rooms and more. There are currently 17 houses in this place within our selection. View also 13 sold houses in Rijkevoort for extra insight into the local housing market.

Selection

Search and filter homes

Set your preferences and discover homes that suit you.

Total supply 243.242
Filters

Set price, area and other characteristics. Adjust a filter or click on Show homes. Location changes directly above.

Reset filters

You search for

  • Place Rijkevoort

Selling a home in Rijkevoort? Compare realtor offers

Get free quotes from real estate agents with local market knowledge. Compare more than 20 real estate agents in Rijkevoort.

Free request a quote

  • Quotes in Rijkevoort
  • Non-binding
  • Personal
  • Compare free rates

Selling a home in Rijkevoort? Compare all real estate agents in Rijkevoort or view the top 10 real estate agents in Rijkevoort for extra context for your choice.

Compare multiple quotes

Real estate agents make sharper offers when they know you're comparing — ask for quotes for sale or purchase.

Frequently asked questions about homes in Rijkevoort

Practical answers about housing supply, sales and comparing real estate agents in Rijkevoort.

Residential and neighborhood statistics in Rijkevoort

View current location data on residents, WOZ development, housing stock, energy consumption, business activity and safety in Rijkevoort. In 2025 were there 1.710 residents. The average WOZ value in 2025 is EUR 442.000.

These figures help to better assess and compare the housing stock in Rijkevoort with recent sold homes. Orient yourself then on suitable top real estate agents in Rijkevoort for sales advice in this region.

Residents

1.710

Last year: 2025

Average WOZ

EUR 442.000

Last year: 2025

Average income per person.

EUR 31.900

Source: AllNumbers

Crimes (current year)

33

Total registered

Demographics and WOZ development

Inhabitants per year

Inhabitants per year in Rijkevoort
Year Residents
2021 1.670
2022 1.715
2023 1.695
2024 1.685
2025 1.710

Annual WOZ value

WOZ value per year in Rijkevoort
Year Average WOZ
2021 EUR 312.000
2022 EUR 347.000
2023 EUR 394.000
2024 EUR 424.000
2025 EUR 442.000

Composition of residents

Age build-up

65+: 405 0-15: 230 15-25: 180 25-45: 385 45-65: 505

Education level

Hoger

370

Praktisch

370

Middelbaar

550

Origin of residents (2025)

Europa

85

Nederland

1.550

Buiten Europa

75

Housing stock and construction periods

Types of homes

Hoekwoningen 46
Appartementen 43
Tussenwoningen 57
Vrijstaande woningen 417
Twee-onder-één-kap woningen 172

Construction period of buildings

Voor 1700 0
1700 tot 1900 15
1900 tot 1925 42
1925 tot 1950 53
1950 tot 1970 156
1970 tot 1980 127
1980 tot 1990 116
1990 tot 2000 72
2000 tot 2010 59
2010 tot 2020 69
2020 en later 46

Energy and sustainability

Energy label distribution

Label A

156

Label C

150

Label B

112

Label D

78

Label G

55

Label F

36

Label E

20

Label A+

20

Label A+++

13

Label A++

7

Label A++++

1

Label A+++++

0

Average energy consumption per year

Average energy consumption per year in Rijkevoort
Year Gas (m3) Electricity (kWh)
2020 1.510 3.570
2021 1.700 3.560
2022 1.310 3.360
2023 1.060 3.230
2024 1.020 3.340

Consumption per house type

Hoekwoning

Gas: 720 • Electricity: 2.820

Huurwoning

Gas: 870 • Electricity: 2.120

Koopwoning

Gas: 1.100 • Electricity: 3.460

Appartement

Gas: 730 • Electricity: 1.820

Tussenwoning

Gas: 730 • Electricity: 2.420

Vrijstaande woning

Gas: 1.230 • Electricity: 3.750

Twee-onder-één-kap woning

Gas: 920 • Electricity: 2.720

Business activity in Rijkevoort (2025)

Handel en HORECA 25
Nijverheid en energie 35
Zakelijke dienstverlening 50
Overheid, onderwijs en zorg 20
Landbouw, bosbouw en visserij 35
Vervoer, informatie en communicatie 5
Financiele diensten en onroerendgoed 10
Cultuur, recreatie en overige diensten 20

Total number of company establishments: 200

Recent crime statistics

Recent crime statistics in Rijkevoort
Period Crimes
jan 2025 6
jan 2026 2
jul 2025 3
jun 2025 3
mei 2025 3
mrt 2025 3
nov 2024 5
nov 2025 3
okt 2024 4
okt 2025 2
sep 2024 3
sep 2025 4

These figures give an indicative picture of safety trends in the living environment of Rijkevoort.

Frequently asked questions about living in Rijkevoort

Short answers based on current local statistics, handy for a quick comparison of the living environment.

Hoeveel inwoners heeft Rijkevoort?

Rijkevoort telt in 2025 ongeveer 1.710 inwoners.

Wat is de gemiddelde WOZ-waarde in Rijkevoort?

De gemiddelde WOZ-waarde in Rijkevoort is in 2025 circa € 442.000.

Wat is het gemiddelde inkomen per inwoner in Rijkevoort?

Het gemiddelde inkomen per inwoner in Rijkevoort ligt rond € 31.900 per jaar.

Hoe veilig is wonen in Rijkevoort?

Voor het huidige jaar gaat het om ongeveer 33 geregistreerde misdrijven. Gebruik deze cijfers als indicatie en vergelijk trends per periode.

Welke woningtypen komen het meest voor in Rijkevoort?

In Rijkevoort komt vooral "Vrijstaande woningen" veel voor, met ongeveer 417 woningen.

Receive free, non-binding quotes

Compare multiple real estate agents and choose the best match.