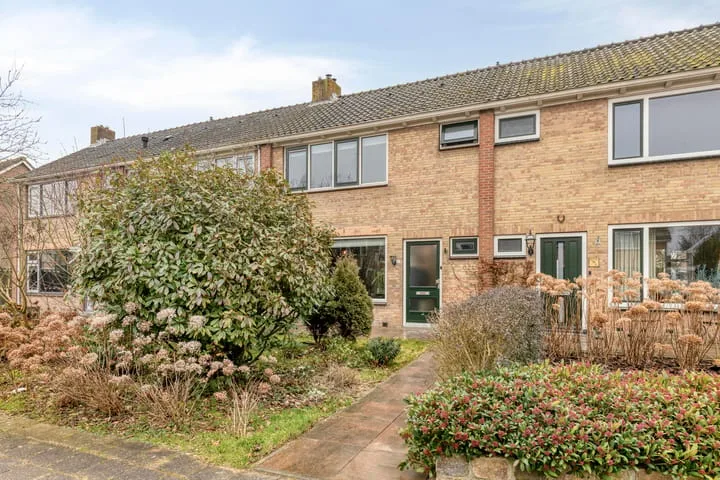
- Sold
Ravenstraat 98
1697KR Schellinkhout
€ 325.000 k.k.
€ 3.779/m²
- Living area
- 86 m²
- Land area
- 220 m²
- Bedrooms
- 4
View 11 sold houses in Schellinkhout
Type to search. Use arrow down and arrow up to navigate through results and press Enter to open.
Hidden search suggestions.
Compare sold homes in Schellinkhout or view the current offering in this location directly.
On this page you will find recently sold homes in Schellinkhout. Use this overview to better estimate selling prices, popular neighborhoods, and the local housing supply before you choose a real estate agent. Also view the current housing supply with 16 houses in Schellinkhout.
1697KR Schellinkhout
€ 325.000 k.k.
€ 3.779/m²
1697KR Schellinkhout
€ 350.000 k.k.
€ 4.022/m²
1697KM Schellinkhout
€ 459.000 k.k.
€ 4.026/m²
1697KN Schellinkhout
€ 365.000 k.k.
€ 3.318/m²
1697KD Schellinkhout
€ 1.575.000 k.k.
€ 6.907/m²
1697KE Schellinkhout
€ 575.000 k.k.
€ 0/m²
1697KT Schellinkhout
€ 549.000 k.k.
€ 4.357/m²
1697KG Schellinkhout
€ 1.195.000 k.k.
€ 4.425/m²
1697KD Schellinkhout
€ 695.000 k.k.
€ 4.186/m²
1697KK Schellinkhout
€ 1.160.000 k.k.
€ 7.204/m²
1697KW Schellinkhout
€ 400.000 k.k.
€ 3.846/m²
Bekijk recente verkopen en ontvang gratis offertes van lokale makelaars. Vergelijk meer dan 32 makelaars in Schellinkhout.
Selling your own home in Schellinkhout? Compare real estate agents in Schellinkhout or view the best real estate agents in Schellinkhout as a reference for your choice.
Real estate agents make sharper offers when they know you're comparing — ask for quotes for sale or purchase.
Short answers about housing prices, sold homes and comparing real estate agents in Schellinkhout.
De kosten van een makelaar in Schellinkhout verschillen per kantoor, woningtype en verkoopaanpak. In Schellinkhout kun je 32 real estate agents vergelijken; bekijk daarom ook de makelaars in Schellinkhout om tarieven, presentatie en lokale ervaring beter naast elkaar te zetten.
On this page we currently show 11 sold houses in Schellinkhout from our selection. This helps you to better assess recent transactions and the local housing market.
Houses sold in Schellinkhout give insight into asking prices, house types and neighborhoods where recent transactions have taken place. Compare this also with the current housing stock in Schellinkhout to better understand the market.
You can use sold homes as a first market indication, but a local real estate agent can better take into account finishing, location, maintenance and current demand in Schellinkhout.
Vergelijk de 32 real estate agents in Schellinkhout op lokale verkoopervaring, reviews, verwachte opbrengst, courtage en marketingaanpak. Bekijk verkoopmakelaars in Schellinkhout of de top 10 makelaars in Schellinkhout om snel sterke kantoren te ontdekken.
View current location data on residents, WOZ development, housing stock, energy consumption, business activity and safety in Schellinkhout. In 2025 were there 855 residents. The average WOZ value in 2025 is EUR 527.000.
These figures help to better assess and compare the housing stock in Schellinkhout with recent sold homes. Orient yourself then on suitable top real estate agents in Schellinkhout for sales advice in this region.
Residents
855
Last year: 2025
Average WOZ
EUR 527.000
Last year: 2025
Average income per person.
EUR 37.500
Source: AllNumbers
Crimes (current year)
22
Total registered
| Year | Residents |
|---|---|
| 2021 | 850 |
| 2022 | 865 |
| 2023 | 865 |
| 2024 | 840 |
| 2025 | 855 |
| Year | Average WOZ |
|---|---|
| 2021 | EUR 384.000 |
| 2022 | EUR 422.000 |
| 2023 | EUR 497.000 |
| 2024 | EUR 516.000 |
| 2025 | EUR 527.000 |
Hoger
230
Praktisch
100
Middelbaar
280
Europa
60
Nederland
740
Buiten Europa
55
Label C
86
Label D
71
Label A
66
Label B
66
Label G
52
Label F
21
Label E
13
Label A+++
4
Label A+
1
Label A++
1
Label A++++
0
Label A+++++
0
| Year | Gas (m3) | Electricity (kWh) |
|---|---|---|
| 2020 | 1.600 | 3.250 |
| 2021 | 1.710 | 3.370 |
| 2022 | 1.370 | 3.140 |
| 2023 | 1.170 | 3.030 |
| 2024 | 1.140 | 3.190 |
Hoekwoning
Gas: 960 • Electricity: 2.200
Huurwoning
Gas: 970 • Electricity: 2.100
Koopwoning
Gas: 1.200 • Electricity: 3.150
Appartement
Gas: 880 • Electricity: 3.660
Tussenwoning
Gas: 900 • Electricity: 2.050
Vrijstaande woning
Gas: 1.300 • Electricity: 3.400
Twee-onder-één-kap woning
Gas: 1.050 • Electricity: 2.730
Total number of company establishments: 150
| Period | Crimes |
|---|---|
| jan 2025 | 1 |
| jan 2026 | 2 |
| jul 2025 | 1 |
| jun 2025 | 1 |
| mei 2025 | 1 |
| mrt 2025 | 6 |
| nov 2024 | 1 |
| nov 2025 | 2 |
| okt 2024 | 1 |
| okt 2025 | 4 |
| sep 2024 | 1 |
| sep 2025 | 1 |
These figures give an indicative picture of safety trends in the living environment of Schellinkhout.
Short answers based on current local statistics, handy for a quick comparison of the living environment.
Schellinkhout telt in 2025 ongeveer 855 inwoners.
De gemiddelde WOZ-waarde in Schellinkhout is in 2025 circa € 527.000.
Het gemiddelde inkomen per inwoner in Schellinkhout ligt rond € 37.500 per jaar.
Voor het huidige jaar gaat het om ongeveer 22 geregistreerde misdrijven. Gebruik deze cijfers als indicatie en vergelijk trends per periode.
In Schellinkhout komt vooral "Vrijstaande woningen" veel voor, met ongeveer 249 woningen.