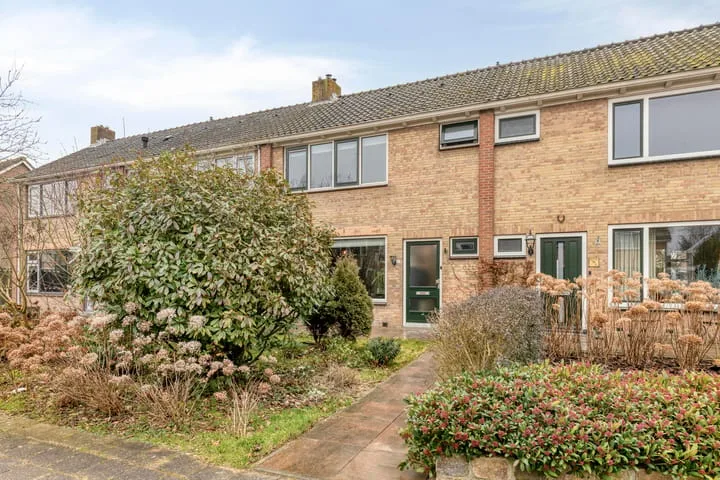
Housing offer in Schellinkhout

Searching in 14 houses in Schellinkhout

Connected to: Vastgoed Nederland NVM Makelaars

View the current housing stock in Schellinkhout and quickly filter by price, living area, rooms and more. There are currently 14 houses in this place within our selection. View also 8 sold houses in Schellinkhout for extra insight into the local housing market.

Selection

Search and filter homes

Set your preferences and discover homes that suit you.

Total supply 244.754
Filters

Set price, area and other characteristics. Adjust a filter or click on Show homes. Location changes directly above.

Reset filters

You search for

  • Place Schellinkhout

Selling a home in Schellinkhout? Compare realtor offers

Get free quotes from real estate agents with local market knowledge. Compare more than 32 real estate agents in Schellinkhout.

Free request a quote

  • Quotes in Schellinkhout
  • Non-binding
  • Personal
  • Compare free rates

Selling a home in Schellinkhout? Compare all real estate agents in Schellinkhout or view the top 10 real estate agents in Schellinkhout for extra context for your choice.

Compare multiple quotes

Real estate agents make sharper offers when they know you're comparing — ask for quotes for sale or purchase.

Frequently asked questions about homes in Schellinkhout

Practical answers about housing supply, sales and comparing real estate agents in Schellinkhout.

Residential and neighborhood statistics in Schellinkhout

View current location data on residents, WOZ development, housing stock, energy consumption, business activity and safety in Schellinkhout. In 2025 were there 855 residents. The average WOZ value in 2025 is EUR 527.000.

These figures help to better assess and compare the housing stock in Schellinkhout with recent sold homes. Orient yourself then on suitable top real estate agents in Schellinkhout for sales advice in this region.

Residents

855

Last year: 2025

Average WOZ

EUR 527.000

Last year: 2025

Average income per person.

EUR 37.500

Source: AllNumbers

Crimes (current year)

22

Total registered

Demographics and WOZ development

Inhabitants per year

Inhabitants per year in Schellinkhout
Year Residents
2021 850
2022 865
2023 865
2024 840
2025 855

Annual WOZ value

WOZ value per year in Schellinkhout
Year Average WOZ
2021 EUR 384.000
2022 EUR 422.000
2023 EUR 497.000
2024 EUR 516.000
2025 EUR 527.000

Composition of residents

Age build-up

65+: 260 0-15: 110 15-25: 85 25-45: 150 45-65: 255

Education level

Hoger

230

Praktisch

100

Middelbaar

280

Origin of residents (2025)

Europa

60

Nederland

740

Buiten Europa

55

Housing stock and construction periods

Types of homes

Hoekwoningen 36
Appartementen 8
Tussenwoningen 52
Vrijstaande woningen 249
Twee-onder-één-kap woningen 37

Construction period of buildings

Voor 1700 3
1700 tot 1900 53
1900 tot 1925 35
1925 tot 1950 12
1950 tot 1970 99
1970 tot 1980 100
1980 tot 1990 17
1990 tot 2000 45
2000 tot 2010 50
2010 tot 2020 8
2020 en later 4

Energy and sustainability

Energy label distribution

Label C

86

Label D

71

Label A

66

Label B

66

Label G

52

Label F

21

Label E

13

Label A+++

4

Label A+

1

Label A++

1

Label A++++

0

Label A+++++

0

Average energy consumption per year

Average energy consumption per year in Schellinkhout
Year Gas (m3) Electricity (kWh)
2020 1.600 3.250
2021 1.710 3.370
2022 1.370 3.140
2023 1.170 3.030
2024 1.140 3.190

Consumption per house type

Hoekwoning

Gas: 960 • Electricity: 2.200

Huurwoning

Gas: 970 • Electricity: 2.100

Koopwoning

Gas: 1.200 • Electricity: 3.150

Appartement

Gas: 880 • Electricity: 3.660

Tussenwoning

Gas: 900 • Electricity: 2.050

Vrijstaande woning

Gas: 1.300 • Electricity: 3.400

Twee-onder-één-kap woning

Gas: 1.050 • Electricity: 2.730

Business activity in Schellinkhout (2025)

Handel en HORECA 10
Nijverheid en energie 20
Zakelijke dienstverlening 40
Overheid, onderwijs en zorg 35
Landbouw, bosbouw en visserij 10
Vervoer, informatie en communicatie 10
Financiele diensten en onroerendgoed 5
Cultuur, recreatie en overige diensten 15

Total number of company establishments: 150

Recent crime statistics

Recent crime statistics in Schellinkhout
Period Crimes
jan 2025 1
jan 2026 2
jul 2025 1
jun 2025 1
mei 2025 1
mrt 2025 6
nov 2024 1
nov 2025 2
okt 2024 1
okt 2025 4
sep 2024 1
sep 2025 1

These figures give an indicative picture of safety trends in the living environment of Schellinkhout.

Frequently asked questions about living in Schellinkhout

Short answers based on current local statistics, handy for a quick comparison of the living environment.

Hoeveel inwoners heeft Schellinkhout?

Schellinkhout telt in 2025 ongeveer 855 inwoners.

Wat is de gemiddelde WOZ-waarde in Schellinkhout?

De gemiddelde WOZ-waarde in Schellinkhout is in 2025 circa € 527.000.

Wat is het gemiddelde inkomen per inwoner in Schellinkhout?

Het gemiddelde inkomen per inwoner in Schellinkhout ligt rond € 37.500 per jaar.

Hoe veilig is wonen in Schellinkhout?

Voor het huidige jaar gaat het om ongeveer 22 geregistreerde misdrijven. Gebruik deze cijfers als indicatie en vergelijk trends per periode.

Welke woningtypen komen het meest voor in Schellinkhout?

In Schellinkhout komt vooral "Vrijstaande woningen" veel voor, met ongeveer 249 woningen.

Receive free, non-binding quotes

Compare multiple real estate agents and choose the best match.