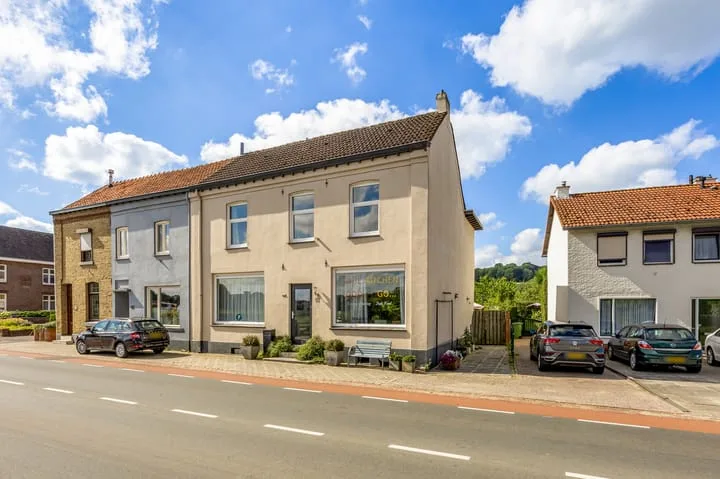
Houses sold in Schin op Geul

View 9 sold houses in Schin op Geul

Connected to: Vastgoed Nederland NVM Makelaars

On this page you will find recently sold homes in Schin op Geul. Use this overview to better estimate selling prices, popular neighborhoods, and the local housing supply before you choose a real estate agent. Also view the current housing supply with 22 houses in Schin op Geul.

Selection

Search and filter homes

Set your preferences and discover homes that suit you.

Total supply 243.352
Filters

Set price, area and other characteristics. Adjust a filter or click on Show homes. Location changes directly above.

Reset filters

You search for

  • Place Schin op Geul
  • Status Sold

Huis verkopen in Schin op Geul? Vergelijk verkoopmakelaars

Bekijk recente verkopen en ontvang gratis offertes van lokale makelaars. Vergelijk meer dan 68 makelaars in Schin op Geul.

Free request a quote

  • Quotes in Schin op Geul
  • Non-binding
  • Personal
  • Compare free rates

Zelf je woning verkopen in Schin op Geul? Vergelijk verkoopmakelaars in Schin op Geul of bekijk de beste verkoopmakelaars in Schin op Geul als referentie bij jouw keuze.

Vergelijk meerdere offertes

Makelaars maken scherpere voorstellen als ze weten dat je vergelijkt — vraag offertes aan voor verkoop of aankoop.

Frequently asked questions about sold homes in Schin op Geul

Short answers about housing prices, sold homes and comparing real estate agents in Schin op Geul.

Residential and neighborhood statistics in Schin op Geul

View current location data on residents, WOZ development, housing stock, energy consumption, business activity and safety in Schin op Geul. In 2026 were there 1.388 residents. The average WOZ value in 2025 is EUR 357.000.

These figures help to better assess and compare the housing stock in Schin op Geul with recent sold homes. Orient yourself then on suitable top real estate agents in Schin op Geul for sales advice in this region.

Residents

1.388

Last year: 2026

Average WOZ

EUR 357.000

Last year: 2025

Average income per person.

EUR 32.300

Source: AllNumbers

Crimes (current year)

55

Total registered

Demographics and WOZ development

Inhabitants per year

Inhabitants per year in Schin op Geul
Year Residents
2021 1.425
2022 1.390
2023 1.415
2024 1.415
2025 1.420
2026 1.388

Annual WOZ value

WOZ value per year in Schin op Geul
Year Average WOZ
2021 EUR 285.000
2022 EUR 296.000
2023 EUR 338.000
2024 EUR 334.000
2025 EUR 357.000

Composition of residents

Age build-up

65+: 435 0-15: 170 15-25: 110 25-45: 285 45-65: 415

Education level

Hoger

400

Praktisch

250

Middelbaar

420

Origin of residents (2025)

Europa

175

Nederland

1.190

Buiten Europa

55

Housing stock and construction periods

Types of homes

Hoekwoningen 78
Appartementen 95
Tussenwoningen 104
Vrijstaande woningen 255
Twee-onder-één-kap woningen 163

Construction period of buildings

Voor 1700 5
1700 tot 1900 93
1900 tot 1925 48
1925 tot 1950 63
1950 tot 1970 188
1970 tot 1980 175
1980 tot 1990 66
1990 tot 2000 22
2000 tot 2010 13
2010 tot 2020 161
2020 en later 1

Energy and sustainability

Energy label distribution

Label C

216

Label G

156

Label F

95

Label D

94

Label A

85

Label E

71

Label B

67

Label A+

11

Label A++

1

Label A+++

0

Label A++++

0

Label A+++++

0

Average energy consumption per year

Average energy consumption per year in Schin op Geul
Year Gas (m3) Electricity (kWh)
2020 1.610 3.130
2021 1.820 3.210
2022 1.430 3.050
2023 1.140 2.840
2024 1.070 2.940

Consumption per house type

Hoekwoning

Gas: 980 • Electricity: 2.750

Huurwoning

Gas: 980 • Electricity: 1.940

Koopwoning

Gas: 1.190 • Electricity: 3.120

Appartement

Gas: 1.050 • Electricity: 2.440

Tussenwoning

Gas: 890 • Electricity: 2.390

Vrijstaande woning

Gas: 1.360 • Electricity: 3.260

Twee-onder-één-kap woning

Gas: 1.110 • Electricity: 2.820

Business activity in Schin op Geul (2025)

Handel en HORECA 45
Nijverheid en energie 20
Zakelijke dienstverlening 35
Overheid, onderwijs en zorg 40
Landbouw, bosbouw en visserij 15
Vervoer, informatie en communicatie 5
Financiele diensten en onroerendgoed 5
Cultuur, recreatie en overige diensten 20

Total number of company establishments: 180

Recent crime statistics

Recent crime statistics in Schin op Geul
Period Crimes
jan 2026 0
jul 2025 6
jun 2025 11
mei 2025 7
mrt 2025 6
mrt 2026 1
nov 2024 5
nov 2025 4
okt 2024 1
okt 2025 2
sep 2024 5
sep 2025 3

These figures give an indicative picture of safety trends in the living environment of Schin op Geul.

Frequently asked questions about living in Schin op Geul

Short answers based on current local statistics, handy for a quick comparison of the living environment.

Hoeveel inwoners heeft Schin op Geul?

Schin op Geul telt in 2026 ongeveer 1.388 inwoners.

Wat is de gemiddelde WOZ-waarde in Schin op Geul?

De gemiddelde WOZ-waarde in Schin op Geul is in 2025 circa € 357.000.

Wat is het gemiddelde inkomen per inwoner in Schin op Geul?

Het gemiddelde inkomen per inwoner in Schin op Geul ligt rond € 32.300 per jaar.

Hoe veilig is wonen in Schin op Geul?

Voor het huidige jaar gaat het om ongeveer 55 geregistreerde misdrijven. Gebruik deze cijfers als indicatie en vergelijk trends per periode.

Welke woningtypen komen het meest voor in Schin op Geul?

In Schin op Geul komt vooral "Vrijstaande woningen" veel voor, met ongeveer 255 woningen.

Receive free, non-binding quotes

Compare multiple real estate agents and choose the best match.