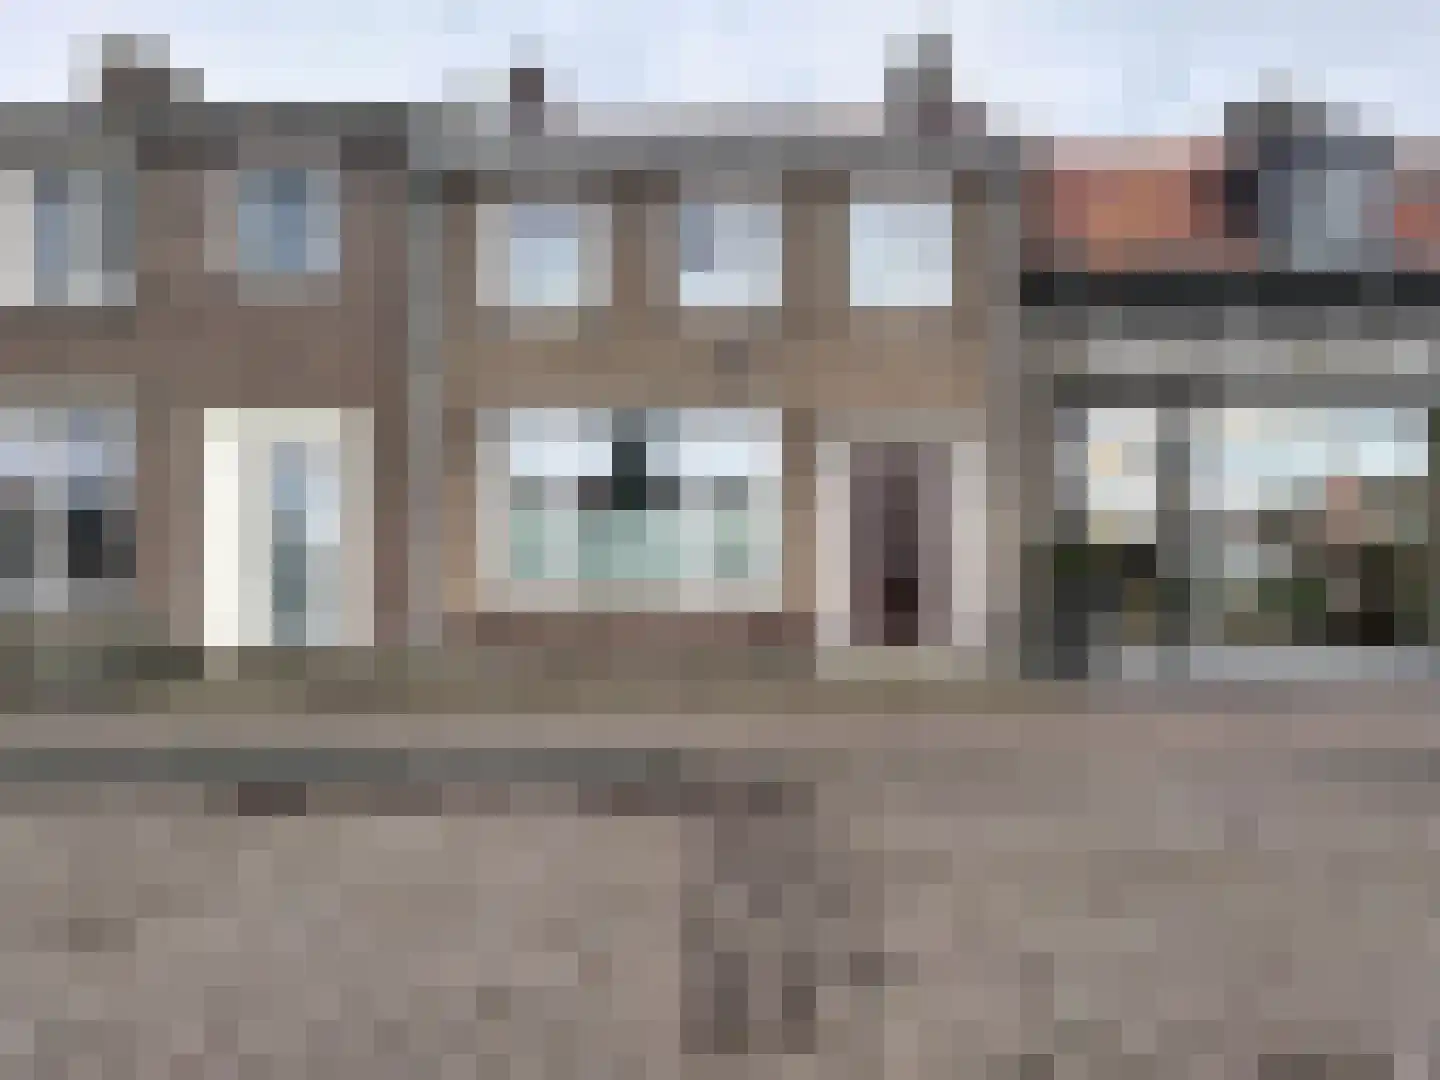
Houses sold in Schoondijke

View 14 sold houses in Schoondijke

Connected to: Vastgoed Nederland NVM Makelaars

On this page you will find recently sold homes in Schoondijke. Use this overview to better estimate selling prices, popular neighborhoods, and the local housing supply before you choose a real estate agent. Also view the current housing supply with 29 houses in Schoondijke.

Selection

Search and filter homes

Set your preferences and discover homes that suit you.

Total supply 242.022
Filters

Set price, area and other characteristics. Adjust a filter or click on Show homes. Location changes directly above.

Reset filters

You search for

  • Place Schoondijke
  • Status Sold

Huis verkopen in Schoondijke? Vergelijk verkoopmakelaars

Bekijk recente verkopen en ontvang gratis offertes van lokale makelaars. Vergelijk meer dan 17 makelaars in Schoondijke.

Free request a quote

  • Quotes in Schoondijke
  • Non-binding
  • Personal
  • Compare free rates

Zelf je woning verkopen in Schoondijke? Vergelijk verkoopmakelaars in Schoondijke of bekijk de beste verkoopmakelaars in Schoondijke als referentie bij jouw keuze.

Vergelijk meerdere offertes

Makelaars maken scherpere voorstellen als ze weten dat je vergelijkt — vraag offertes aan voor verkoop of aankoop.

Frequently asked questions about sold homes in Schoondijke

Short answers about housing prices, sold homes and comparing real estate agents in Schoondijke.

Residential and neighborhood statistics in Schoondijke

View current location data on residents, WOZ development, housing stock, energy consumption, business activity and safety in Schoondijke. In 2025 were there 1.460 residents. The average WOZ value in 2025 is EUR 268.120.

These figures help to better assess and compare the housing stock in Schoondijke with recent sold homes. Orient yourself then on suitable top real estate agents in Schoondijke for sales advice in this region.

Residents

1.460

Last year: 2025

Average WOZ

EUR 268.120

Last year: 2025

Average income per person.

EUR 30.185

Source: AllNumbers

Crimes (current year)

32

Total registered

Demographics and WOZ development

Inhabitants per year

Inhabitants per year in Schoondijke
Year Residents
2021 1.432
2022 1.410
2023 1.446
2024 1.464
2025 1.460

Annual WOZ value

WOZ value per year in Schoondijke
Year Average WOZ
2021 EUR 194.829
2022 EUR 218.092
2023 EUR 247.097
2024 EUR 261.228
2025 EUR 268.120

Composition of residents

Age build-up

65+: 334 0-15: 196 15-25: 146 25-45: 369 45-65: 415

Education level

Hoger

175

Praktisch

294

Middelbaar

549

Origin of residents (2025)

Europa

479

Nederland

929

Buiten Europa

61

Housing stock and construction periods

Types of homes

Hoekwoningen 130
Appartementen 38
Tussenwoningen 272
Vrijstaande woningen 241
Twee-onder-één-kap woningen 79

Construction period of buildings

Voor 1700 5
1700 tot 1900 43
1900 tot 1925 102
1925 tot 1950 231
1950 tot 1970 308
1970 tot 1980 73
1980 tot 1990 36
1990 tot 2000 36
2000 tot 2010 38
2010 tot 2020 35
2020 en later 23

Energy and sustainability

Energy label distribution

Label G

156

Label C

153

Label F

118

Label E

113

Label D

91

Label B

73

Label A

70

Label A+

4

Label A++

3

Label A+++

1

Label A++++

1

Label A+++++

0

Average energy consumption per year

Average energy consumption per year in Schoondijke
Year Gas (m3) Electricity (kWh)
2020 1.295 2.608
2021 1.476 2.749
2022 1.160 2.603
2023 1.000 2.494
2024 967 2.535

Consumption per house type

Hoekwoning

Gas: 884 • Electricity: 2.206

Huurwoning

Gas: 835 • Electricity: 1.817

Koopwoning

Gas: 1.058 • Electricity: 2.699

Appartement

Gas: 577 • Electricity: 1.230

Tussenwoning

Gas: 778 • Electricity: 1.783

Vrijstaande woning

Gas: 1.204 • Electricity: 2.960

Twee-onder-één-kap woning

Gas: 891 • Electricity: 2.477

Business activity in Schoondijke (2025)

Handel en HORECA 31
Nijverheid en energie 26
Zakelijke dienstverlening 31
Overheid, onderwijs en zorg 20
Landbouw, bosbouw en visserij 37
Vervoer, informatie en communicatie 5
Financiele diensten en onroerendgoed 10
Cultuur, recreatie en overige diensten 20

Total number of company establishments: 194

Recent crime statistics

Recent crime statistics in Schoondijke
Period Crimes
jan 2026 1
jul 2025 4
jun 2025 2
mei 2025 5
mrt 2025 0
mrt 2026 3
nov 2024 2
nov 2025 0
okt 2024 0
okt 2025 3
sep 2024 1
sep 2025 1

These figures give an indicative picture of safety trends in the living environment of Schoondijke.

Frequently asked questions about living in Schoondijke

Short answers based on current local statistics, handy for a quick comparison of the living environment.

Hoeveel inwoners heeft Schoondijke?

Schoondijke telt in 2025 ongeveer 1.460 inwoners.

Wat is de gemiddelde WOZ-waarde in Schoondijke?

De gemiddelde WOZ-waarde in Schoondijke is in 2025 circa € 268.120.

Wat is het gemiddelde inkomen per inwoner in Schoondijke?

Het gemiddelde inkomen per inwoner in Schoondijke ligt rond € 30.185 per jaar.

Hoe veilig is wonen in Schoondijke?

Voor het huidige jaar gaat het om ongeveer 32 geregistreerde misdrijven. Gebruik deze cijfers als indicatie en vergelijk trends per periode.

Welke woningtypen komen het meest voor in Schoondijke?

In Schoondijke komt vooral "Tussenwoningen" veel voor, met ongeveer 272 woningen.

Receive free, non-binding quotes

Compare multiple real estate agents and choose the best match.