Residents
4.351
Last year: 2026
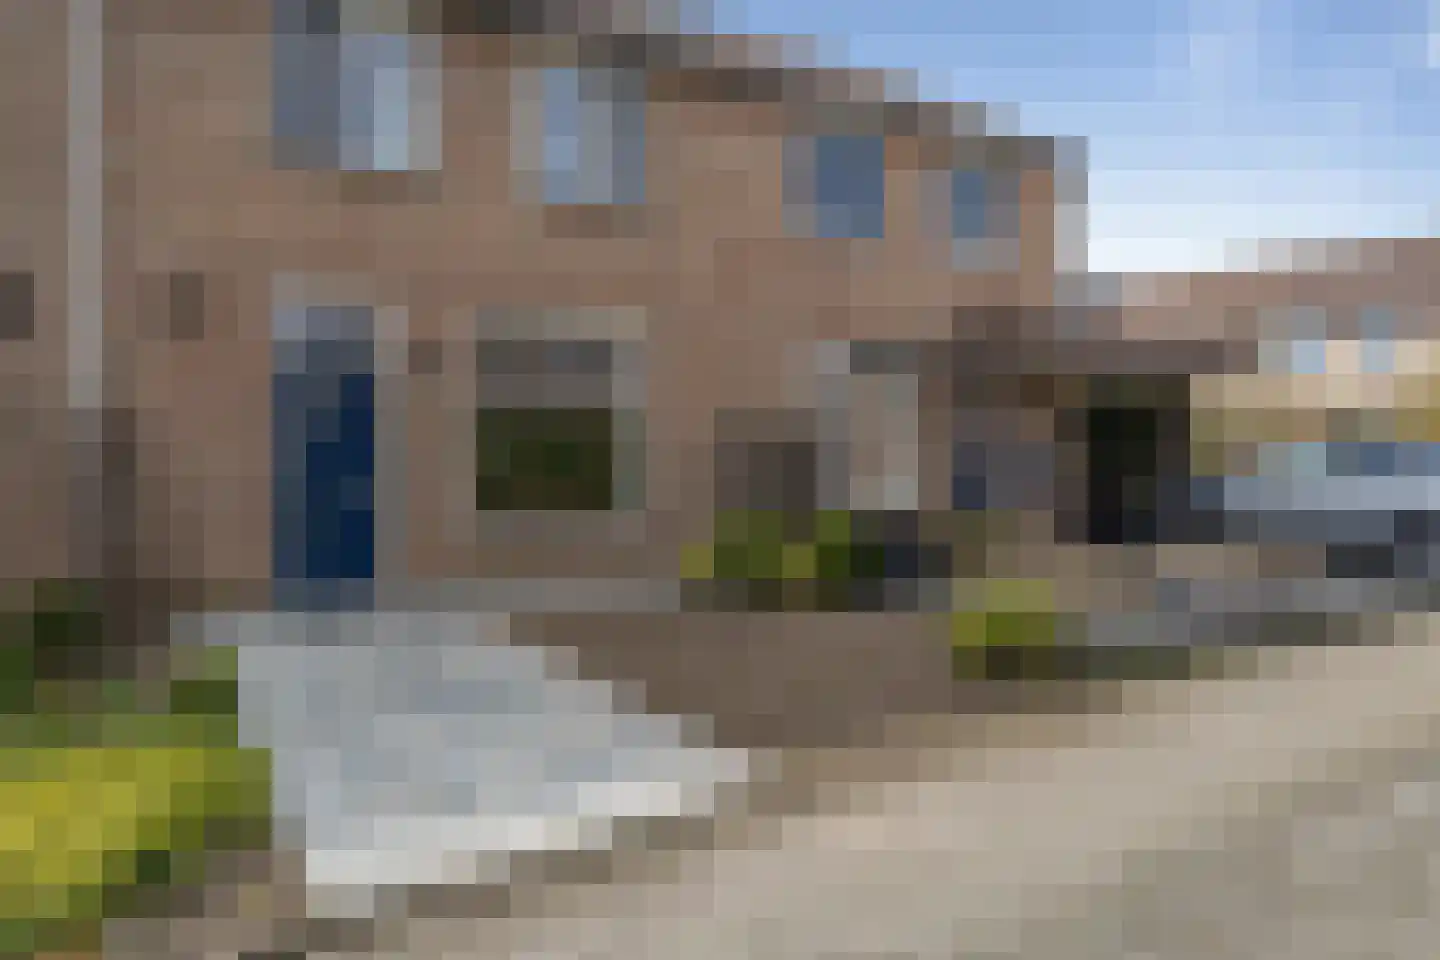
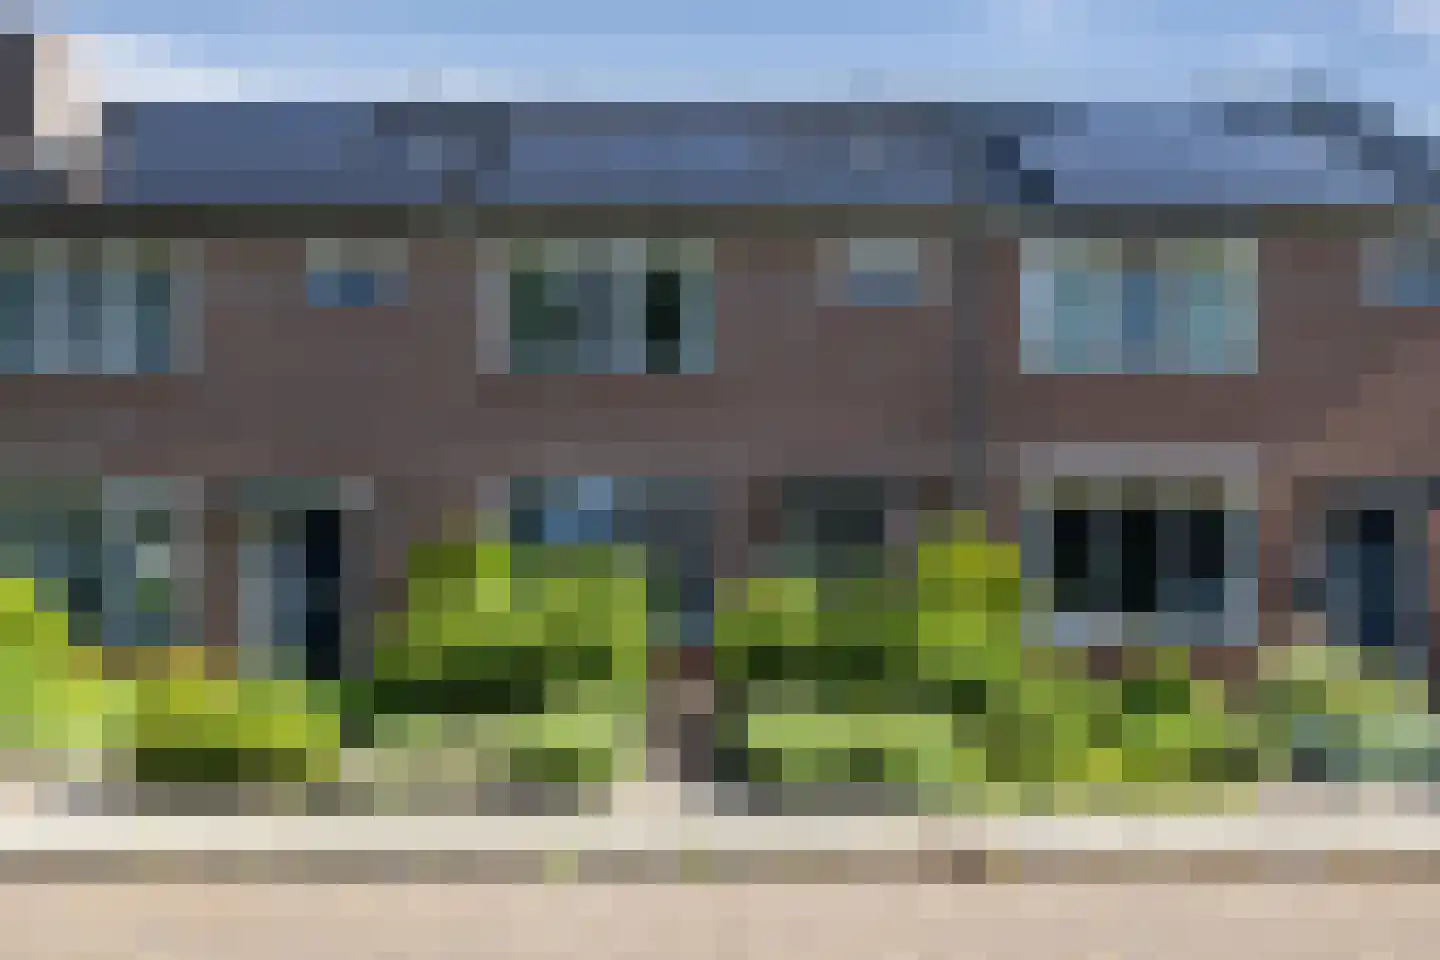
7761DT Schoonebeek • Drenthe
€ 260.000 k.k.
Cost of copper (estimated): € 7.050
2% transfer tax (€ 5.200) + notary (€ 1.150) + valuation (€ 700)
Total incl. VAT: € 267.050
Purchase price /m²: € 2.241
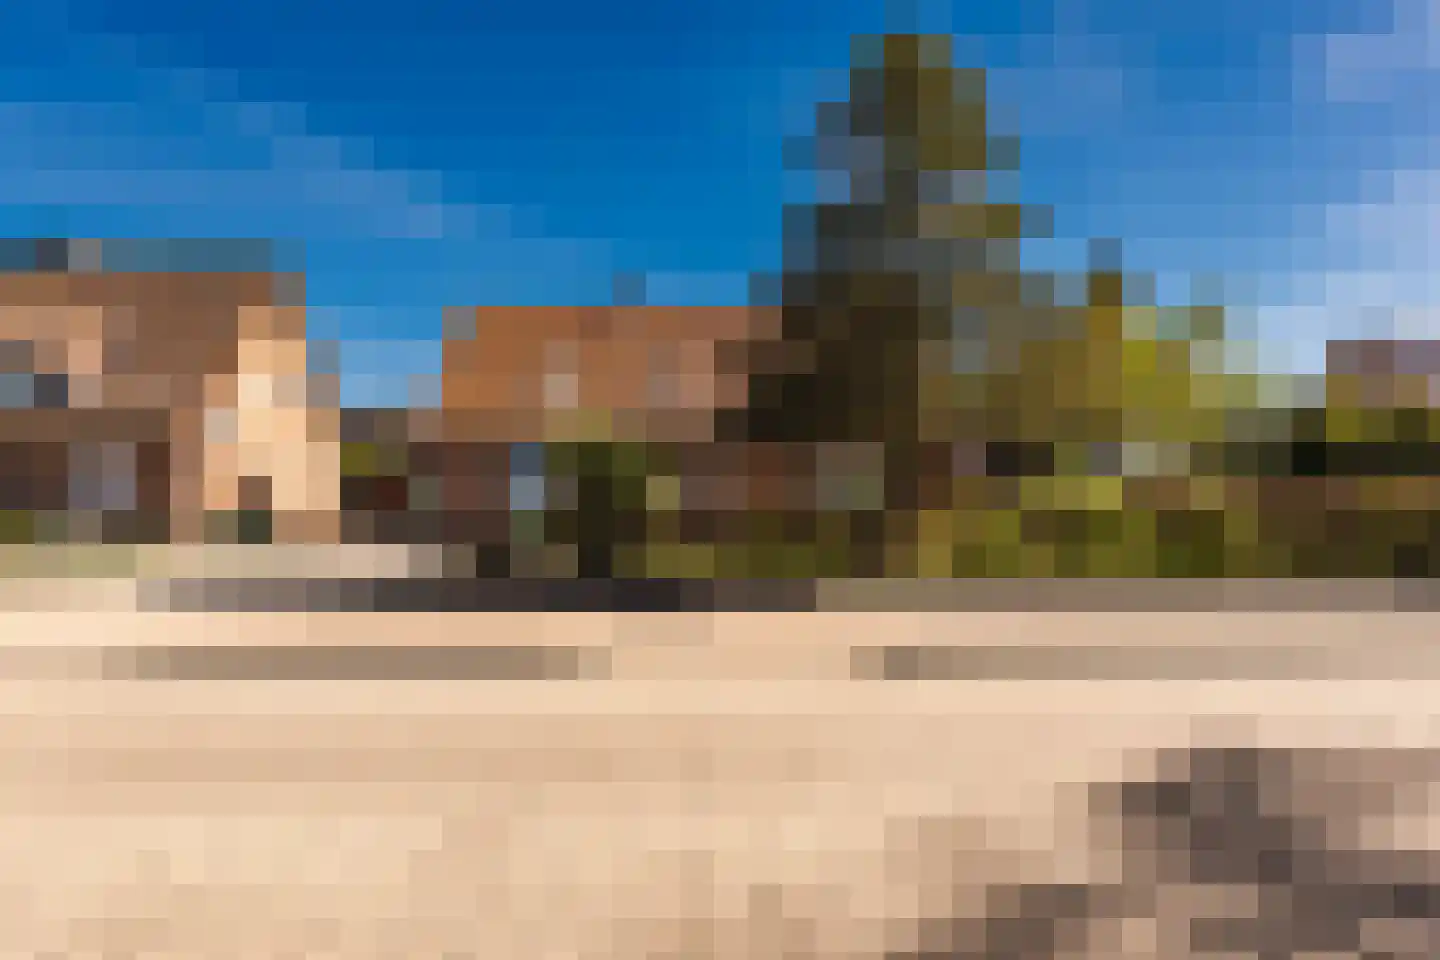
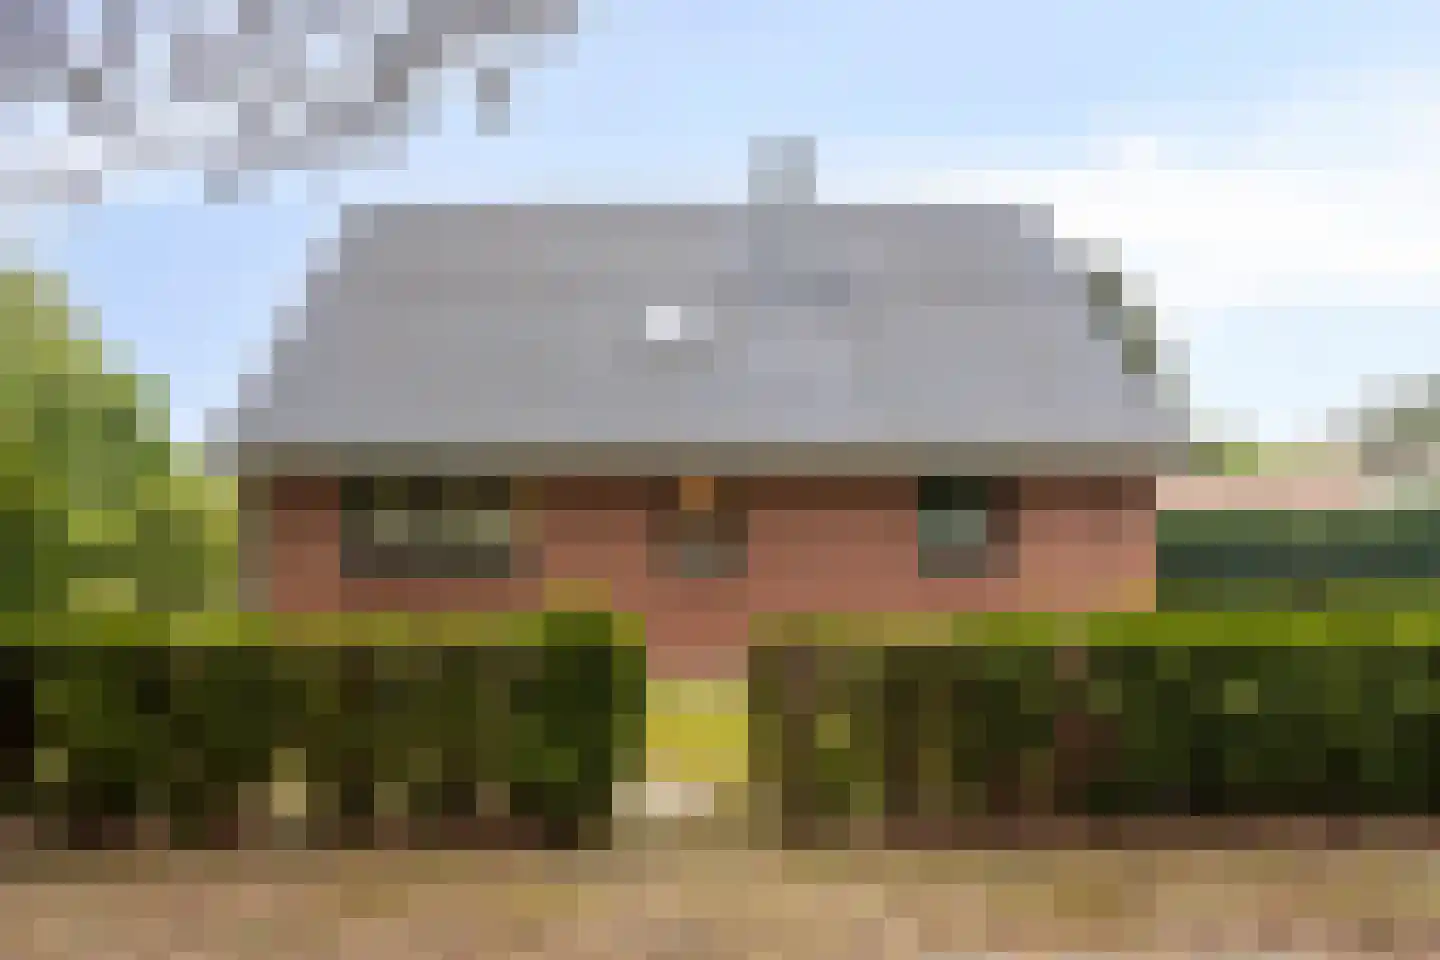
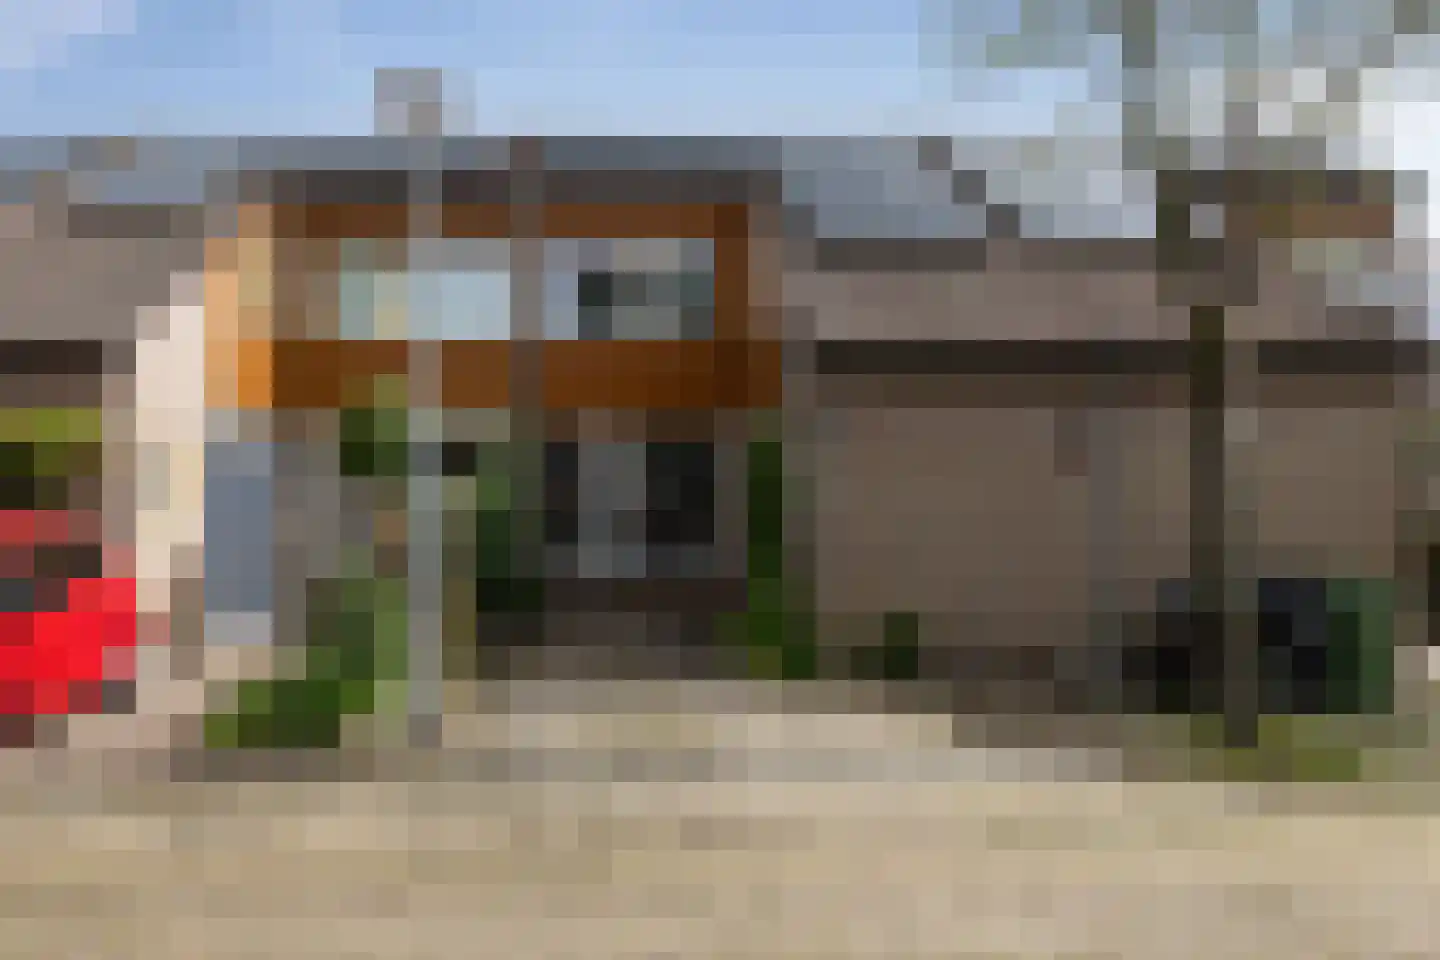
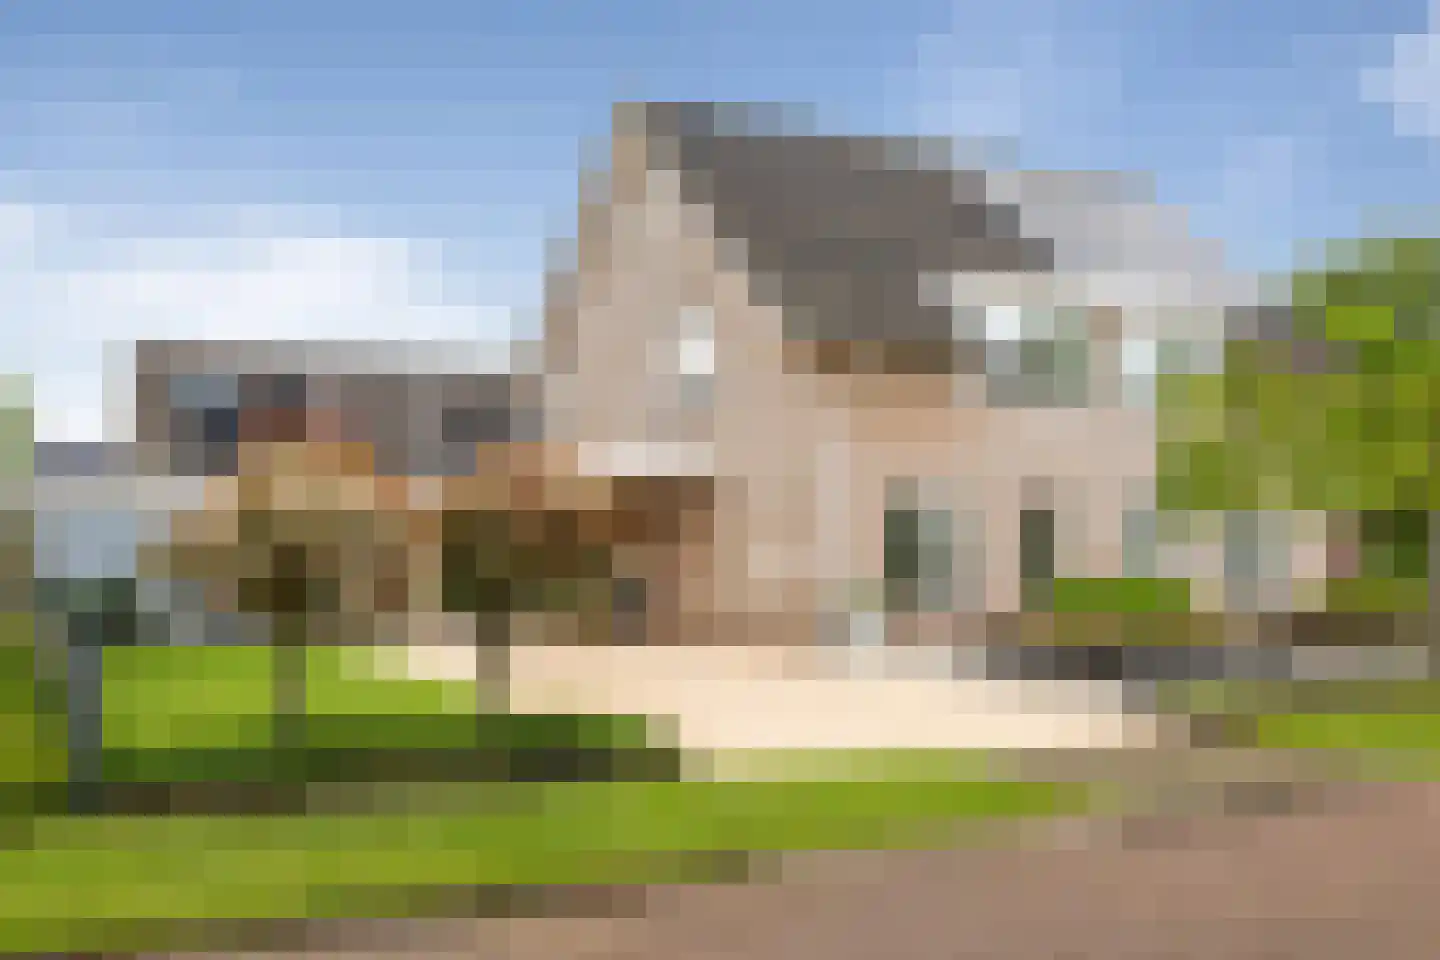
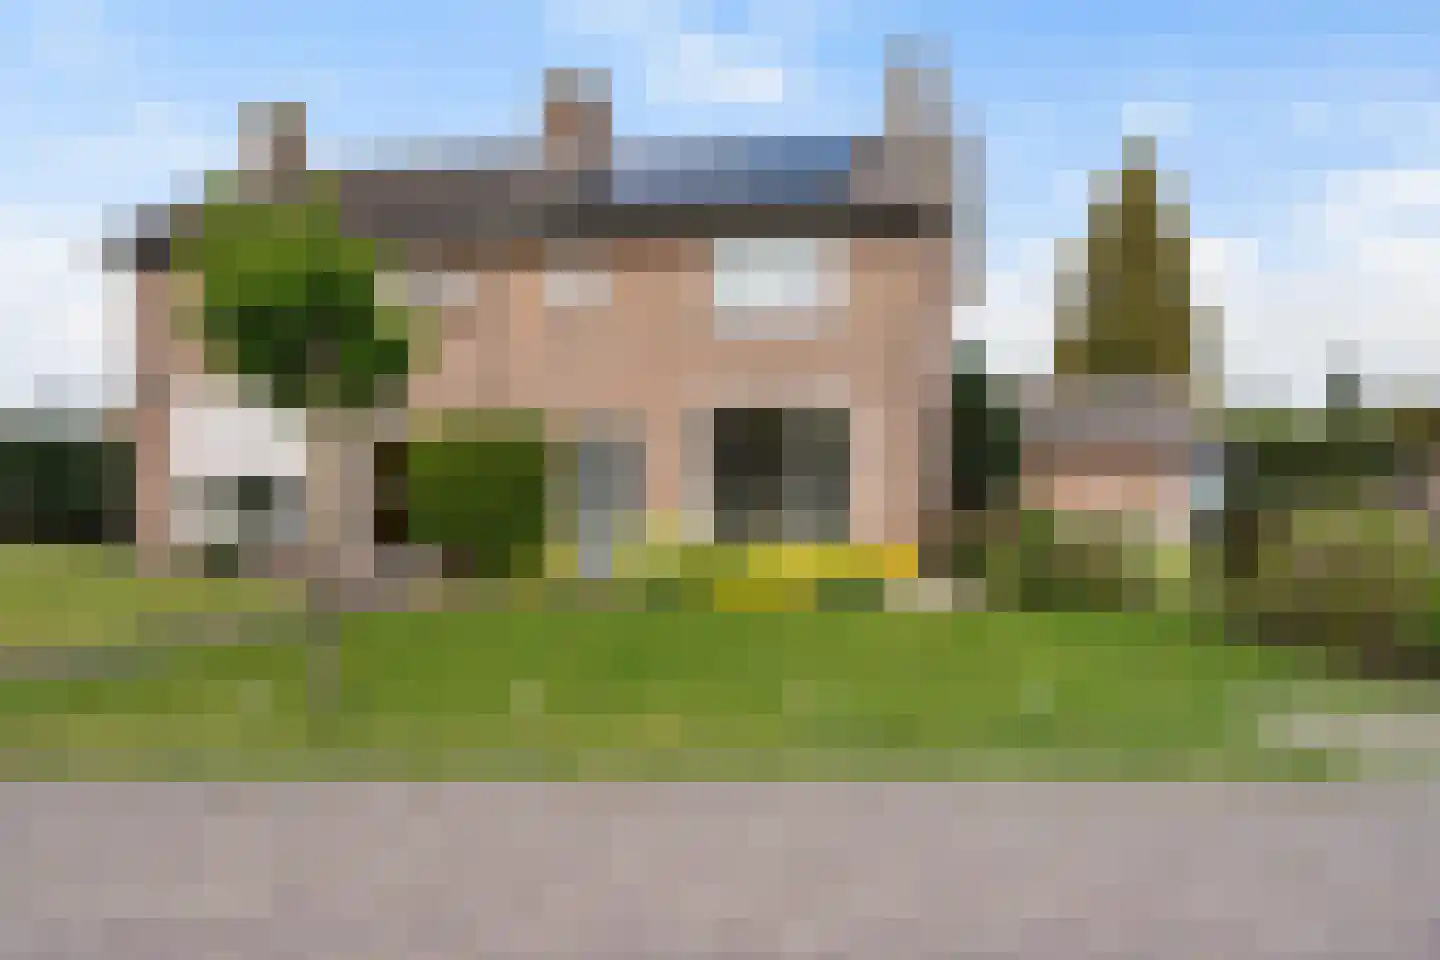
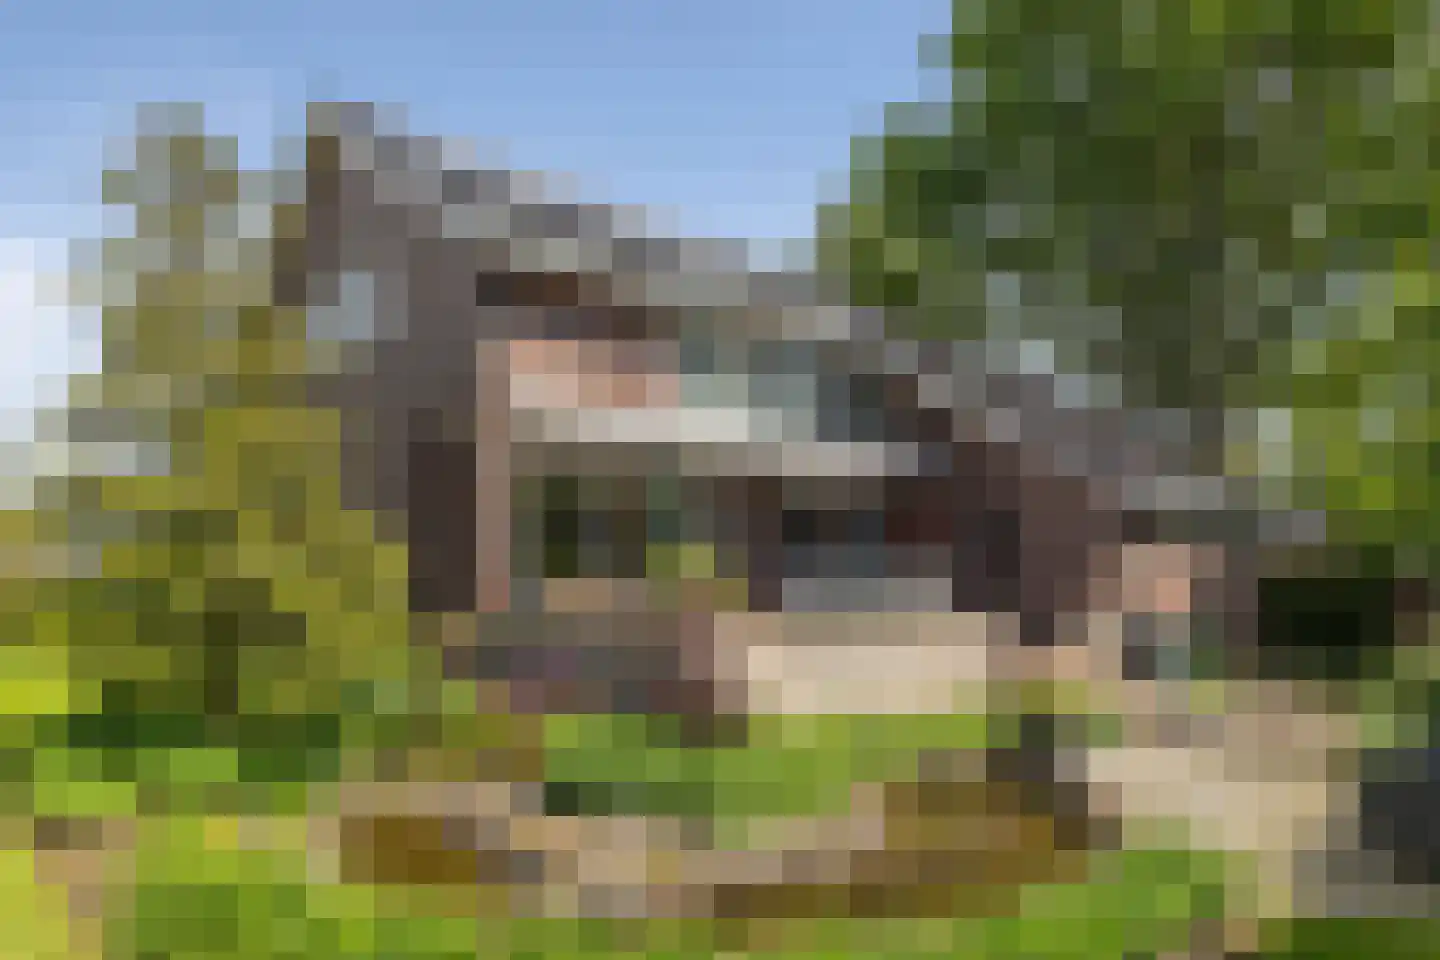
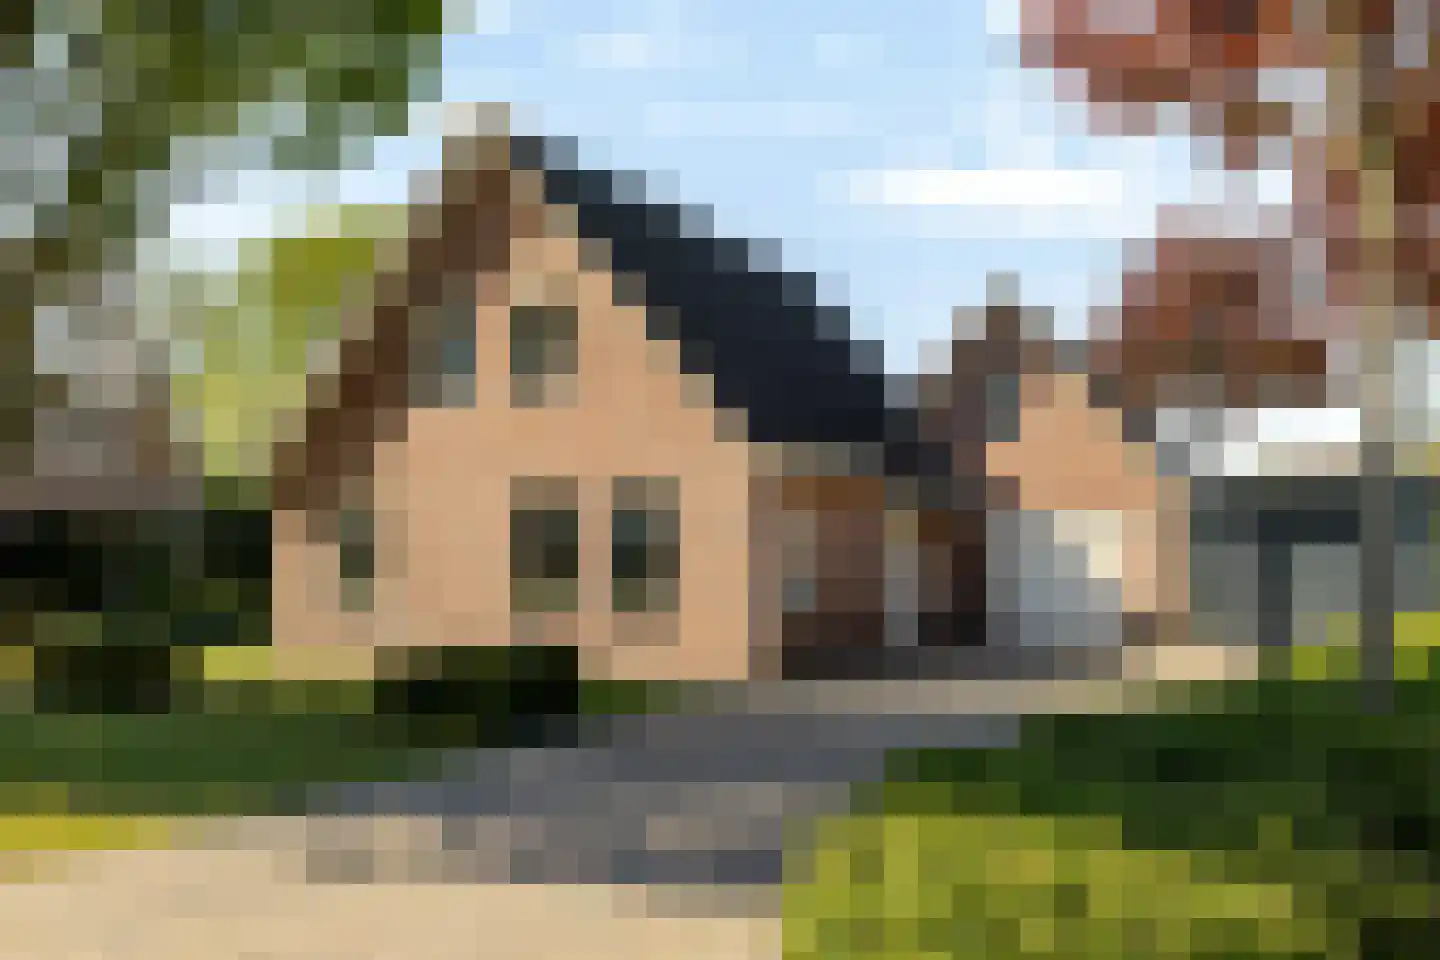
Ben je op zoek naar een goed onderhouden, betaalbare tussenwoning in een rustige en kindvriendelijke buurt? Dan is Achterkamp 17 in Schoonebeek absoluut een bezichtiging waard. Deze ruime gezinswoning ligt op een ideale locatie: aan de voorzijde kijk je uit over een groenstrook met voldoende parkeergelegenheid, terwijl je aan de achterzijde zó de speeltuin inloopt. Ideaal voor gezinnen, starters of iedereen die graag comfortabel en ruim wil wonen. De woning beschikt over maar liefst 116 m² woonoppervlakte, staat op een perceel van 164 m² en is nagenoeg instapklaar. Met vier ruime slaapkamers, een zolder met dakkapel en een zonnige tuin is dit een huis waar je jarenlang met plezier kunt wonen. Ligging De locatie is perfect: op loopafstand vind je het centrum van Schoonebeek, veel groen, een zwembad en diverse voorzieningen. Rustig wonen met alles dichtbij. Indeling Begane grond Via de entree kom je binnen in de hal met een luxe, modern afgewerkt toilet voorzien van een hangend closet en fonteintje. De lichte woonkamer heeft grote raampartijen en een strakke laminaatvloer, wat zorgt voor een prettige en open sfeer. De open keuken is compleet uitgerust met een inductiekookplaat (2020), afzuiging (2024), koelkast (2024), combi-oven en vaatwasser. Vanuit de keuken is de praktische bijkeuken bereikbaar met wasmachineaansluitingen en een deur naar de zonnige achtertuin. Eerste verdieping Overloop met vaste trap naar de tweede verdieping, drie netjes afgewerkte slaapkamers en een complete badkamer voorzien van douchecabine, wastafel, tweede toilet en badmeubel. Tweede verdieping Bereikbaar via een vaste trap. Ruime overloop met cv-opstelling, bergruimte en een dakkapel die zorgt voor extra licht en ruimte. Hier bevindt zich de vierde, royale slaapkamer. Buitenruimte De keurig onderhouden achtertuin op het zuidwesten biedt volop zon en privacy. De tuin is voorzien van een tuinhuisje met overkapping. Achter het tuinhuisje bevindt zich een achterom die direct toegang geeft tot de speeltuin, ideaal voor kinderen. Fietsen kunnen gemakkelijk in de tuin of het tuinhuisje worden gestald. Kortom Een ruime, lichte en verzorgde tussenwoning op een toplocatie in een kindvriendelijke buurt. Of je nu een gezin hebt (of wilt starten), een starter bent of gewoon op zoek bent naar ruimte en comfort: Achterkamp 17 is een plek waar je je direct thuis voelt! Pluspunten van de woning - Energielabel C - Woonoppervlakte van 116 m² - Goed onderhouden woning - Voorzien van kunststof kozijnen - Vier ruime slaapkamers - Zolder met dakkapel voor extra leefruimte - Achtertuin op het zuidwesten - Grenzend aan speeltuin aan de achterzijde - Voldoende parkeergelegenheid aan de voorzijde - Vrij uitzicht aan de voorzijde over groenstrook Deze informatie is door ons met de nodige zorgvuldigheid samengesteld. Er wordt echter geen enkele aansprakelijkheid aanvaard voor enige onvolledigheid, onjuistheid of dan wel de gevolgen daarvan. Alle opgegeven maten en oppervlakten zijn indicatief. Van toepassing zijn de NVM voorwaarden
€ 260.000
Cost of copper (estimated): € 7.050
2% transfer tax (€ 5.200) + notary (€ 1.150) + valuation (€ 700)
Total purchase (incl. p.p.): € 267.050
3,02%
Yearly
€ 13.000
Direct available
Estimated mortgage
Indicative gross monthly cost
Based on annuity and 30 year term
Indicative net monthly cost
iDisclaimer: this mortgage calculation is a simplified indication based on general assumptions. No rights can be derived from the results shown. Calculated with 10-annual interest (met NHG), automatically determined based on the price limit € 470.000. Source: 10-jaars rente uit mortgage_rates (08-06-2026 03:45).
Douche, ligbad, toilet, en wastafelmeubel
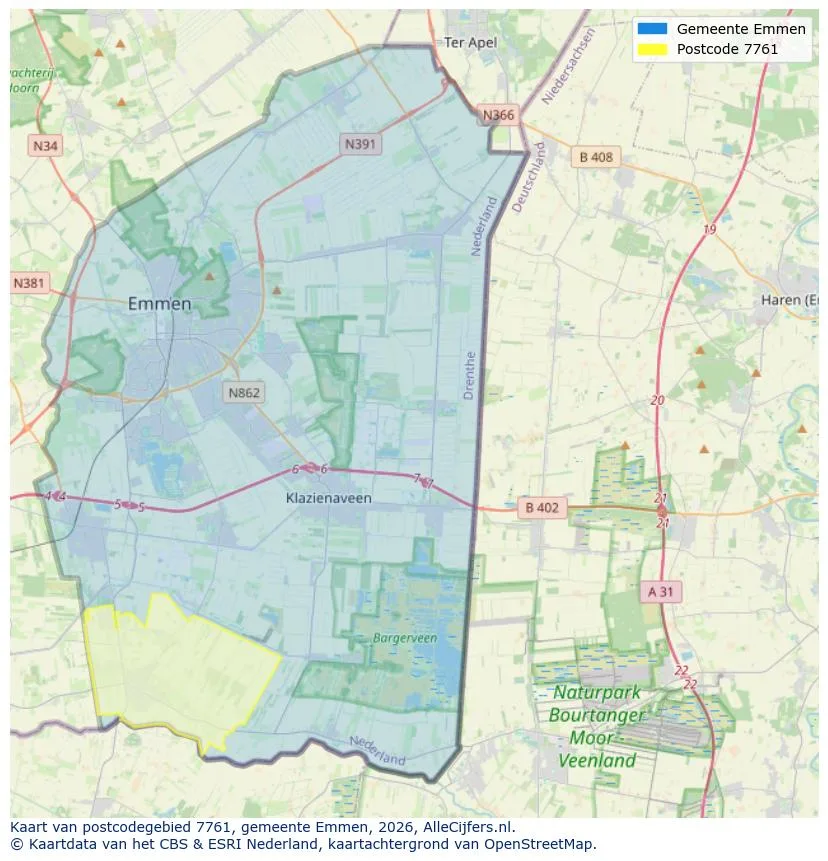
Spatial overview of the work area in Schoonebeek
View current location data on residents, WOZ development, housing stock, energy consumption, business activity and safety in Schoonebeek. In 2026 were there 4.351 residents. The average WOZ value in 2025 is EUR 296.850.
Residents
4.351
Last year: 2026
Average WOZ
EUR 296.850
Last year: 2025
Average income per person.
EUR 26.801
Source: AllNumbers
Crimes (current year)
96
Total registered
| Year | Residents |
|---|---|
| 2021 | 4.365 |
| 2022 | 4.400 |
| 2023 | 4.385 |
| 2024 | 4.390 |
| 2025 | 4.390 |
| 2026 | 4.351 |
| Year | Average WOZ |
|---|---|
| 2021 | EUR 204.483 |
| 2022 | EUR 227.916 |
| 2023 | EUR 262.957 |
| 2024 | EUR 277.903 |
| 2025 | EUR 296.850 |
Hoger
580
Praktisch
830
Middelbaar
1.570
Europa
255
Nederland
4.000
Buiten Europa
135
Label A
607
Label C
513
Label B
315
Label D
163
Label G
156
Label F
138
Label E
88
Label A+
18
Label A+++
16
Label A++
11
Label A++++
2
Label A+++++
0
| Year | Gas (m3) | Electricity (kWh) |
|---|---|---|
| 2020 | 1.425 | 3.052 |
| 2021 | 1.558 | 3.151 |
| 2022 | 1.215 | 2.990 |
| 2023 | 1.025 | 2.902 |
| 2024 | 990 | 3.081 |
Hoekwoning
Gas: 885 • Electricity: 2.200
Huurwoning
Gas: 799 • Electricity: 2.082
Koopwoning
Gas: 1.096 • Electricity: 3.142
Appartement
Gas: 644 • Electricity: 1.440
Tussenwoning
Gas: 832 • Electricity: 2.066
Vrijstaande woning
Gas: 1.238 • Electricity: 3.572
Twee-onder-één-kap woning
Gas: 945 • Electricity: 2.928
Total number of company establishments: 380
| Period | Crimes |
|---|---|
| jan 2026 | 12 |
| jul 2025 | 6 |
| jun 2025 | 10 |
| mei 2025 | 9 |
| mrt 2025 | 10 |
| mrt 2026 | 6 |
| nov 2024 | 3 |
| nov 2025 | 9 |
| okt 2024 | 4 |
| okt 2025 | 6 |
| sep 2024 | 11 |
| sep 2025 | 6 |
These figures give an indicative picture of safety trends in the living environment of Schoonebeek.
Short answers based on current local statistics, handy for a quick comparison of the living environment.
Schoonebeek telt in 2026 ongeveer 4.351 inwoners.
De gemiddelde WOZ-waarde in Schoonebeek is in 2025 circa € 296.850.
Het gemiddelde inkomen per inwoner in Schoonebeek ligt rond € 26.801 per jaar.
Voor het huidige jaar gaat het om ongeveer 96 geregistreerde misdrijven. Gebruik deze cijfers als indicatie en vergelijk trends per periode.
In Schoonebeek komt vooral "Twee-onder-één-kap woningen" veel voor, met ongeveer 697 woningen.
View more homes in this location.
7761XJ Schoonebeek
€ 282.000 k.k.
€ 2.186/m²
Schoonebeek
€ 245.000 k.k.
€ 1.531/m²
2222AM Schoonebeek
€ 209.000 k.k.
€ 1.866/m²
7761DG Schoonebeek
€ 259.500 k.k.
€ 2.569/m²
7761KA Schoonebeek
€ 399.500 k.k.
€ 3.567/m²
7761BB Schoonebeek
€ 275.000 k.k.
€ 3.198/m²
7761ZA Schoonebeek
€ 550.000 k.k.
€ 3.005/m²
7761HC Schoonebeek
€ 539.500 k.k.
