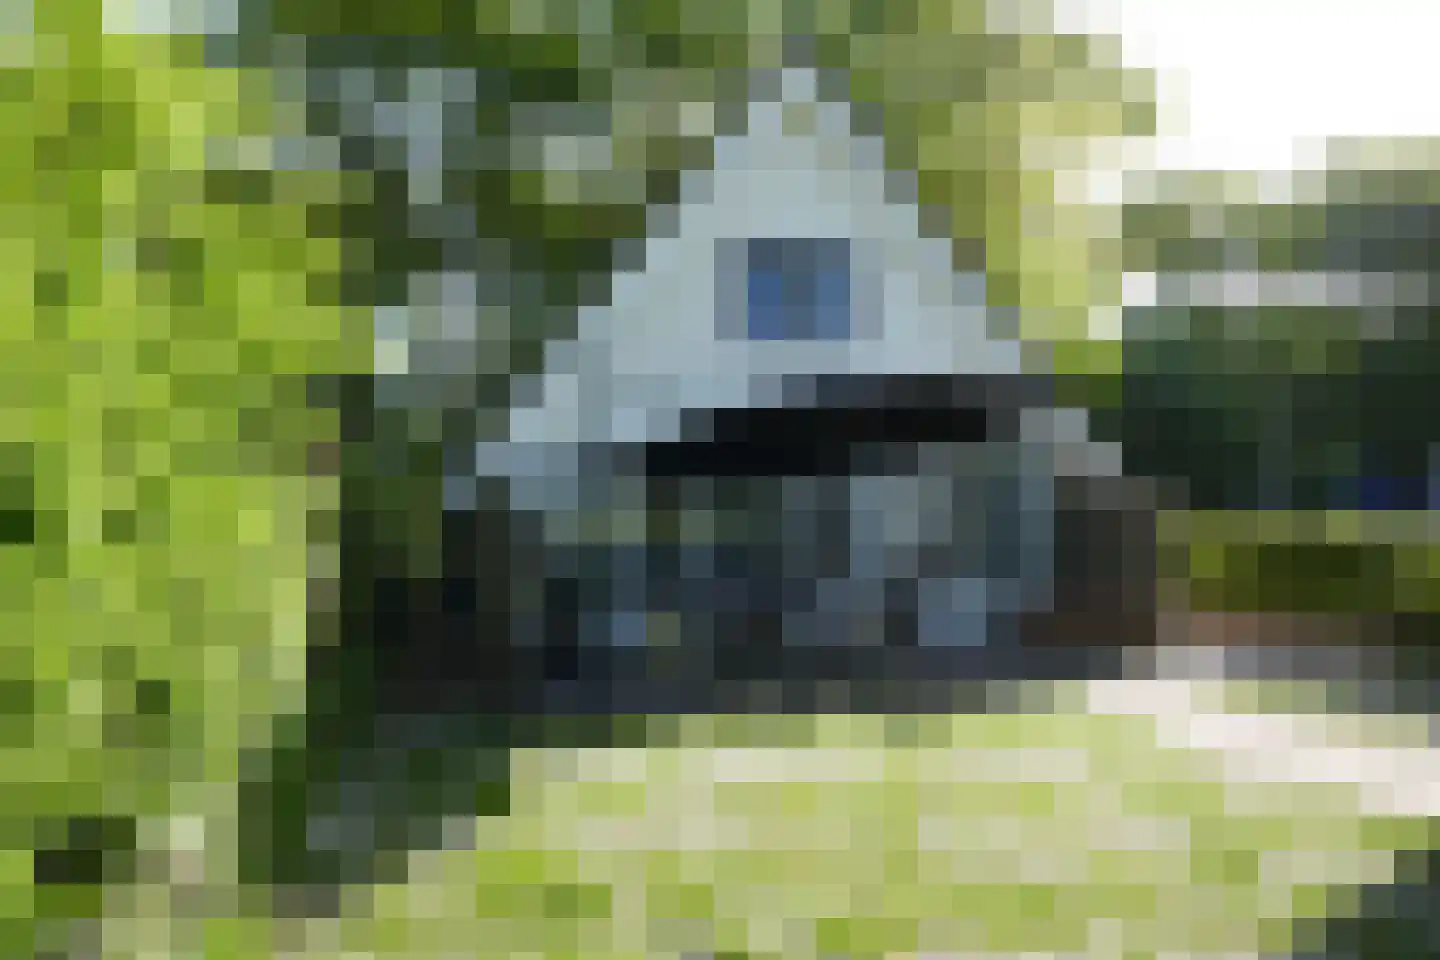
- Available
Ruigeweg 78 B
1752HE Sint Maartensbrug
€ 625.000 k.k.
€ 5.435/m²
- Living area
- 115 m²
- Land area
- 425 m²
- Bedrooms
- 3
Searching in 11 houses in Sint Maartensbrug
Type to search. Use arrow down and arrow up to navigate through results and press Enter to open.
Hidden search suggestions.
View current properties in Sint Maartensbrug or search targeted on street, postal code and property characteristics.
View the current housing stock in Sint Maartensbrug and quickly filter by price, living area, rooms and more. There are currently 11 houses in this place within our selection. View also 5 sold houses in Sint Maartensbrug for extra insight into the local housing market.
1752HE Sint Maartensbrug
€ 625.000 k.k.
€ 5.435/m²
1752HC Sint Maartensbrug
€ 300.000 k.k.
1752AB Sint Maartensbrug
€ 425.000 k.k.
€ 2.707/m²
1752HD Sint Maartensbrug
€ 209.000 k.k.
€ 4.644/m²
1752HD Sint Maartensbrug
€ 229.500 k.k.
€ 4.781/m²
1752JP Sint Maartensbrug
€ 925.000 k.k.
€ 6.126/m²
1752AG Sint Maartensbrug
€ 369.000 k.k.
€ 3.153/m²
1752HD Sint Maartensbrug
€ 215.000 k.k.
€ 4.479/m²
1752JN Sint Maartensbrug
€ 576.500 k.k.
€ 4.969/m²
1752HB Sint Maartensbrug
€ 480.000 k.k.
€ 4.528/m²
1752AH Sint Maartensbrug
€ 335.000 k.k.
€ 3.045/m²
Get free quotes from real estate agents with local market knowledge. Compare more than 16 real estate agents in Sint Maartensbrug.
Selling a home in Sint Maartensbrug? Compare all real estate agents in Sint Maartensbrug or view the top 10 real estate agents in Sint Maartensbrug for extra context for your choice.
Real estate agents make sharper offers when they know you're comparing — ask for quotes for sale or purchase.
Practical answers about housing supply, sales and comparing real estate agents in Sint Maartensbrug.
The costs of a real estate agent in Sint Maartensbrug depend on commission, setup costs, property presentation and the chosen service. Compare the 16 real estate agents in Sint Maartensbrug via the real estate agent page and request multiple quotes to compare rates and approach well.
Within our selection, we are currently showing 11 houses in Sint Maartensbrug. View also the sold houses in Sint Maartensbrug to compare the current offering with recent transactions.
Take into account not only price and living area but also maintenance, energy label, location, outdoor space and sales status. This way you compare houses in Sint Maartensbrug on more than just the asking price.
A local real estate agent knows the neighborhoods, recent transactions and demand in Sint Maartensbrug. By comparing 16 real estate agents in the region you get a better insight into prices, sales strategy and expected yield; the top 10 in Sint Maartensbrug provides a useful starting point.
Yes, when making a sales plan, a valuation in Sint Maartensbrug is wise. You gain insight into a realistic asking price and can then compare offers from real estate agents specifically.
View current location data on residents, WOZ development, housing stock, energy consumption, business activity and safety in Sint Maartensbrug. In 2025 were there 725 residents. The average WOZ value in 2025 is EUR 401.000.
These figures help to better assess and compare the housing stock in Sint Maartensbrug with recent sold homes. Orient yourself then on suitable top real estate agents in Sint Maartensbrug for sales advice in this region.
Residents
725
Last year: 2025
Average WOZ
EUR 401.000
Last year: 2025
Average income per person.
EUR 35.100
Source: AllNumbers
Crimes (current year)
13
Total registered
| Year | Residents |
|---|---|
| 2021 | 720 |
| 2022 | 735 |
| 2023 | 735 |
| 2024 | 735 |
| 2025 | 725 |
| Year | Average WOZ |
|---|---|
| 2021 | EUR 298.000 |
| 2022 | EUR 333.000 |
| 2023 | EUR 363.000 |
| 2024 | EUR 377.000 |
| 2025 | EUR 401.000 |
Hoger
130
Praktisch
120
Middelbaar
320
Europa
45
Nederland
660
Buiten Europa
25
Label G
92
Label C
80
Label D
63
Label B
26
Label A
23
Label F
21
Label E
10
Label A+
2
Label A++
0
Label A+++
0
Label A++++
0
Label A+++++
0
| Year | Gas (m3) | Electricity (kWh) |
|---|---|---|
| 2020 | 1.620 | 3.430 |
| 2021 | 1.830 | 3.620 |
| 2022 | 1.400 | 3.360 |
| 2023 | 1.180 | 3.200 |
| 2024 | 1.130 | 3.240 |
Hoekwoning
Gas: 1.070 • Electricity: 2.890
Huurwoning
Gas: 1.570 • Electricity: 3.140
Koopwoning
Gas: 1.160 • Electricity: 3.200
Appartement
Gas: 830 • Electricity: 2.720
Tussenwoning
Gas: 920 • Electricity: 2.780
Vrijstaande woning
Gas: 1.330 • Electricity: 3.360
Twee-onder-één-kap woning
Gas: 1.010 • Electricity: 3.860
Total number of company establishments: 115
| Period | Crimes |
|---|---|
| jan 2025 | 0 |
| jan 2026 | 1 |
| jul 2025 | 5 |
| jun 2025 | 0 |
| mei 2025 | 0 |
| mrt 2025 | 1 |
| nov 2024 | 1 |
| nov 2025 | 1 |
| okt 2024 | 3 |
| okt 2025 | 3 |
| sep 2024 | 1 |
| sep 2025 | 1 |
These figures give an indicative picture of safety trends in the living environment of Sint Maartensbrug.
Short answers based on current local statistics, handy for a quick comparison of the living environment.
Sint Maartensbrug telt in 2025 ongeveer 725 inwoners.
De gemiddelde WOZ-waarde in Sint Maartensbrug is in 2025 circa € 401.000.
Het gemiddelde inkomen per inwoner in Sint Maartensbrug ligt rond € 35.100 per jaar.
Voor het huidige jaar gaat het om ongeveer 13 geregistreerde misdrijven. Gebruik deze cijfers als indicatie en vergelijk trends per periode.
In Sint Maartensbrug komt vooral "Vrijstaande woningen" veel voor, met ongeveer 191 woningen.