
Residents
1.600
Last year: 2025
3243AL Stad aan 't Haringvliet • Zuid-Holland
€ 385.000 k.k.
Cost of copper (estimated): € 9.550
2% transfer tax (€ 7.700) + notary (€ 1.150) + valuation (€ 700)
Total incl. VAT: € 394.550
For this property, no detailed description is available yet.
€ 385.000
Cost of copper (estimated): € 9.550
2% transfer tax (€ 7.700) + notary (€ 1.150) + valuation (€ 700)
Total purchase (incl. p.p.): € 394.550
2,78%
Yearly
€ 19.250
Direct available
Estimated mortgage
Indicative gross monthly cost
Based on annuity and 30 year term
Indicative net monthly cost
iDisclaimer: this mortgage calculation is a simplified indication based on general assumptions. No rights can be derived from the results shown. Calculated with 10-annual interest (met NHG), automatically determined based on the price limit € 470.000. Source: 10-jaars rente uit mortgage_rates (06-05-2026 03:45).
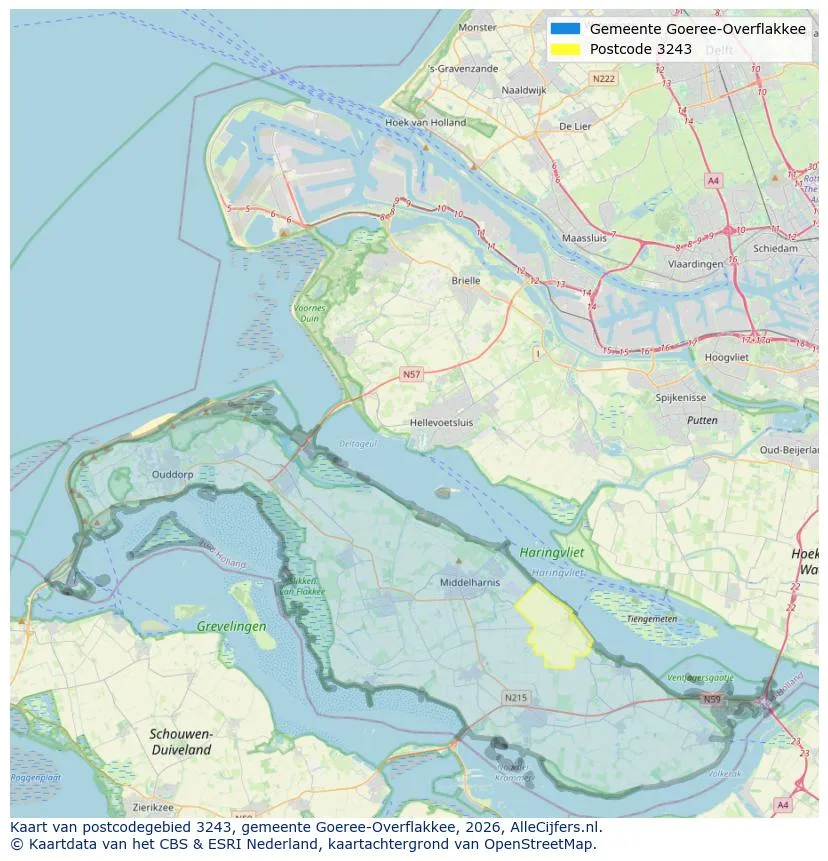
View the location and discover the brokers in this region
View current location data on residents, WOZ development, housing stock, energy consumption, business activity and safety in Stad aan 't Haringvliet. In 2025 were there 1.600 residents. The average WOZ value in 2025 is EUR 348.000.
Residents
1.600
Last year: 2025
Average WOZ
EUR 348.000
Last year: 2025
Average income per person.
EUR 33.700
Source: AllNumbers
Crimes (current year)
35
Total registered
| Year | Residents |
|---|---|
| 2021 | 1.475 |
| 2022 | 1.515 |
| 2023 | 1.525 |
| 2024 | 1.540 |
| 2025 | 1.600 |
| Year | Average WOZ |
|---|---|
| 2021 | EUR 235.000 |
| 2022 | EUR 265.000 |
| 2023 | EUR 319.000 |
| 2024 | EUR 334.000 |
| 2025 | EUR 348.000 |
Hoger
290
Praktisch
320
Middelbaar
600
Europa
80
Nederland
1.425
Buiten Europa
100
Label C
159
Label A
134
Label G
113
Label F
79
Label D
76
Label B
70
Label E
37
Label A+++
37
Label A+
8
Label A++
8
Label A+++++
1
Label A++++
0
| Year | Gas (m3) | Electricity (kWh) |
|---|---|---|
| 2020 | 1.340 | 2.890 |
| 2021 | 1.450 | 3.080 |
| 2022 | 1.100 | 2.880 |
| 2023 | 920 | 2.800 |
| 2024 | 920 | 2.910 |
Hoekwoning
Gas: 770 • Electricity: 2.390
Huurwoning
Gas: 750 • Electricity: 1.890
Koopwoning
Gas: 990 • Electricity: 3.160
Appartement
Gas: 680 • Electricity: 1.710
Tussenwoning
Gas: 650 • Electricity: 2.280
Vrijstaande woning
Gas: 1.250 • Electricity: 3.600
Twee-onder-één-kap woning
Gas: 920 • Electricity: 2.820
Total number of company establishments: 205
| Period | Crimes |
|---|---|
| jan 2025 | 6 |
| jan 2026 | 2 |
| jul 2025 | 5 |
| jun 2025 | 1 |
| mei 2025 | 0 |
| mrt 2025 | 1 |
| nov 2024 | 1 |
| nov 2025 | 2 |
| okt 2024 | 2 |
| okt 2025 | 6 |
| sep 2024 | 1 |
| sep 2025 | 5 |
These figures give an indicative picture of safety trends in the living environment of Stad aan 't Haringvliet.
Short answers based on current local statistics, handy for a quick comparison of the living environment.
Stad aan 't Haringvliet telt in 2025 ongeveer 1.600 inwoners.
De gemiddelde WOZ-waarde in Stad aan 't Haringvliet is in 2025 circa € 348.000.
Het gemiddelde inkomen per inwoner in Stad aan 't Haringvliet ligt rond € 33.700 per jaar.
Voor het huidige jaar gaat het om ongeveer 35 geregistreerde misdrijven. Gebruik deze cijfers als indicatie en vergelijk trends per periode.
In Stad aan 't Haringvliet komt vooral "Vrijstaande woningen" veel voor, met ongeveer 206 woningen.
View more homes in this location.

3243AE Stad aan 't Haringvliet
€ 239.500 k.k.

3243LA Stad aan 't Haringvliet
€ 825.000 k.k.
€ 5.935/m²

3243BG Stad aan 't Haringvliet
€ 520.000 k.k.
€ 4.094/m²
3243AG Stad aan 't Haringvliet
€ 425.000 k.k.
€ 3.195/m²
3243AG Stad aan 't Haringvliet
€ 495.000 k.k.
€ 3.640/m²

3243AN Stad aan 't Haringvliet
€ 369.500 k.k.
€ 4.060/m²

3243AM Stad aan 't Haringvliet
€ 590.000 k.k.
€ 4.958/m²

3243AH Stad aan 't Haringvliet
€ 795.000 k.k.
€ 6.795/m²
