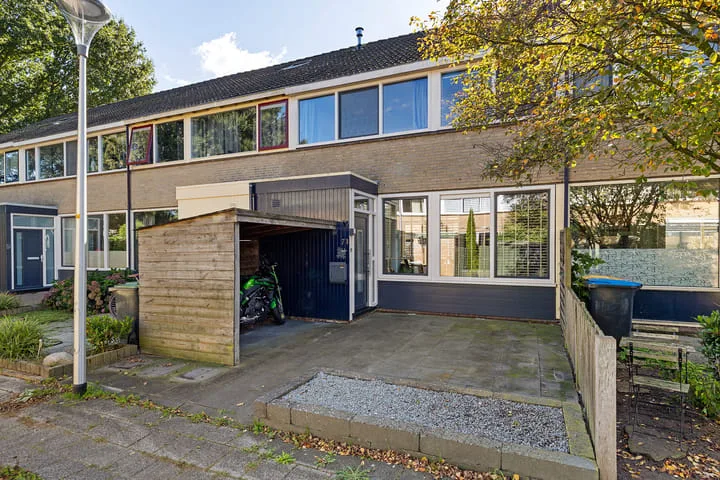
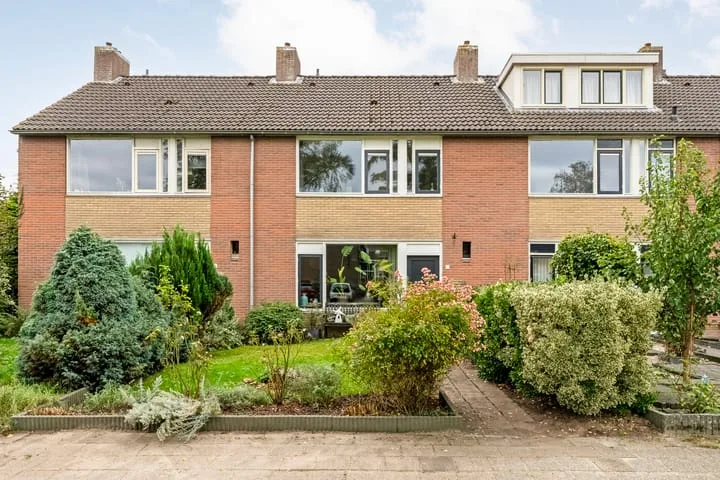
Houses sold in Steenwijk

View 194 sold houses in Steenwijk

Connected to: Vastgoed Nederland NVM Makelaars

On this page you will find recently sold homes in Steenwijk. Use this overview to better estimate selling prices, popular neighborhoods, and the local housing supply before you choose a real estate agent. Also view the current housing supply with 249 houses in Steenwijk.

Selection

Search and filter homes

Set your preferences and discover homes that suit you.

Total supply 240.906
Filters

Set price, area and other characteristics. Adjust a filter or click on Show homes. Location changes directly above.

Reset filters

You search for

  • Place Steenwijk
  • Status Sold

Selling a home in Steenwijk? Compare realtor offers

Get free quotes from realtors with local market knowledge in Steenwijk.

Free request a quote

  • Quotes in Steenwijk
  • Non-binding
  • Personal
  • Free property website

Selling a home in Steenwijk? Compare real estate agents who know the local housing market. Also check out all real estate agents in Steenwijk or the top 10 real estate agents in Steenwijk for extra context for your choice.

Save an average of €5000,-

By comparing brokers and requesting quotes

Frequently asked questions about sold homes in Steenwijk

Short answers about housing prices, sold homes and comparing real estate agents in Steenwijk.

Residential and neighborhood statistics in Steenwijk

View current location data on residents, WOZ development, housing stock, energy consumption, business activity and safety in Steenwijk. In 2025 were there 17.620 residents. The average WOZ value in 2025 is EUR 286.000.

These figures help to better assess and compare the housing stock in Steenwijk with recent sold homes. Orient yourself then on suitable top real estate agents in Steenwijk for sales advice in this region.

Residents

17.620

Last year: 2025

Average WOZ

EUR 286.000

Last year: 2025

Average income per person.

EUR 30.300

Source: AllNumbers

Crimes (current year)

752

Total registered

Demographics and WOZ development

Inhabitants per year

Inhabitants per year in Steenwijk
Year Residents
2021 17.110
2022 17.200
2023 17.495
2024 17.515
2025 17.620

Annual WOZ value

WOZ value per year in Steenwijk
Year Average WOZ
2021 EUR 201.000
2022 EUR 223.000
2023 EUR 259.000
2024 EUR 273.000
2025 EUR 286.000

Composition of residents

Age build-up

65+: 4.410 0-15: 2.545 15-25: 1.945 25-45: 4.020 45-65: 4.705

Education level

Hoger

3.430

Praktisch

3.610

Middelbaar

5.860

Origin of residents (2025)

Europa

895

Nederland

14.700

Buiten Europa

2.015

Housing stock and construction periods

Types of homes

Hoekwoningen 1.533
Appartementen 2.308
Tussenwoningen 2.702
Vrijstaande woningen 994
Twee-onder-één-kap woningen 1.292

Construction period of buildings

Voor 1700 6
1700 tot 1900 228
1900 tot 1925 477
1925 tot 1950 604
1950 tot 1970 1.136
1970 tot 1980 1.623
1980 tot 1990 605
1990 tot 2000 975
2000 tot 2010 999
2010 tot 2020 449
2020 en later 525

Energy and sustainability

Energy label distribution

Label A

2.392

Label C

2.334

Label B

1.559

Label D

683

Label G

582

Label F

405

Label E

336

Label A+++

214

Label A+

188

Label A++++

181

Label A++

131

Label A+++++

3

Average energy consumption per year

Average energy consumption per year in Steenwijk
Year Gas (m3) Electricity (kWh)
2020 1.180 2.470
2021 1.340 2.530
2022 1.050 2.410
2023 870 2.310
2024 840 2.380

Consumption per house type

Hoekwoning

Gas: 960 • Electricity: 2.390

Huurwoning

Gas: 750 • Electricity: 1.840

Koopwoning

Gas: 980 • Electricity: 2.720

Appartement

Gas: 650 • Electricity: 1.670

Tussenwoning

Gas: 860 • Electricity: 2.220

Vrijstaande woning

Gas: 1.180 • Electricity: 3.540

Twee-onder-één-kap woning

Gas: 960 • Electricity: 2.610

Business activity in Steenwijk (2025)

Handel en HORECA 465
Nijverheid en energie 330
Zakelijke dienstverlening 395
Overheid, onderwijs en zorg 320
Landbouw, bosbouw en visserij 15
Vervoer, informatie en communicatie 115
Financiele diensten en onroerendgoed 90
Cultuur, recreatie en overige diensten 210

Total number of company establishments: 1.950

Recent crime statistics

Recent crime statistics in Steenwijk
Period Crimes
jan 2025 58
jan 2026 49
jul 2025 62
jun 2025 66
mei 2025 71
mrt 2025 57
nov 2024 56
nov 2025 54
okt 2024 45
okt 2025 78
sep 2024 57
sep 2025 76

These figures give an indicative picture of safety trends in the living environment of Steenwijk.

Frequently asked questions about living in Steenwijk

Short answers based on current local statistics, handy for a quick comparison of the living environment.

Hoeveel inwoners heeft Steenwijk?

Steenwijk telt in 2025 ongeveer 17.620 inwoners.

Wat is de gemiddelde WOZ-waarde in Steenwijk?

De gemiddelde WOZ-waarde in Steenwijk is in 2025 circa € 286.000.

Wat is het gemiddelde inkomen per inwoner in Steenwijk?

Het gemiddelde inkomen per inwoner in Steenwijk ligt rond € 30.300 per jaar.

Hoe veilig is wonen in Steenwijk?

Voor het huidige jaar gaat het om ongeveer 752 geregistreerde misdrijven. Gebruik deze cijfers als indicatie en vergelijk trends per periode.

Welke woningtypen komen het meest voor in Steenwijk?

In Steenwijk komt vooral "Tussenwoningen" veel voor, met ongeveer 2.702 woningen.