Residents
5.440
Last year: 2025
2821WC Stolwijk • Zuid-Holland
€ 450.000 k.k.
Cost of copper (estimated): € 10.850
2% transfer tax (€ 9.000) + notary (€ 1.150) + valuation (€ 700)
Total incl. VAT: € 460.850
Purchase price /m²: € 4.245
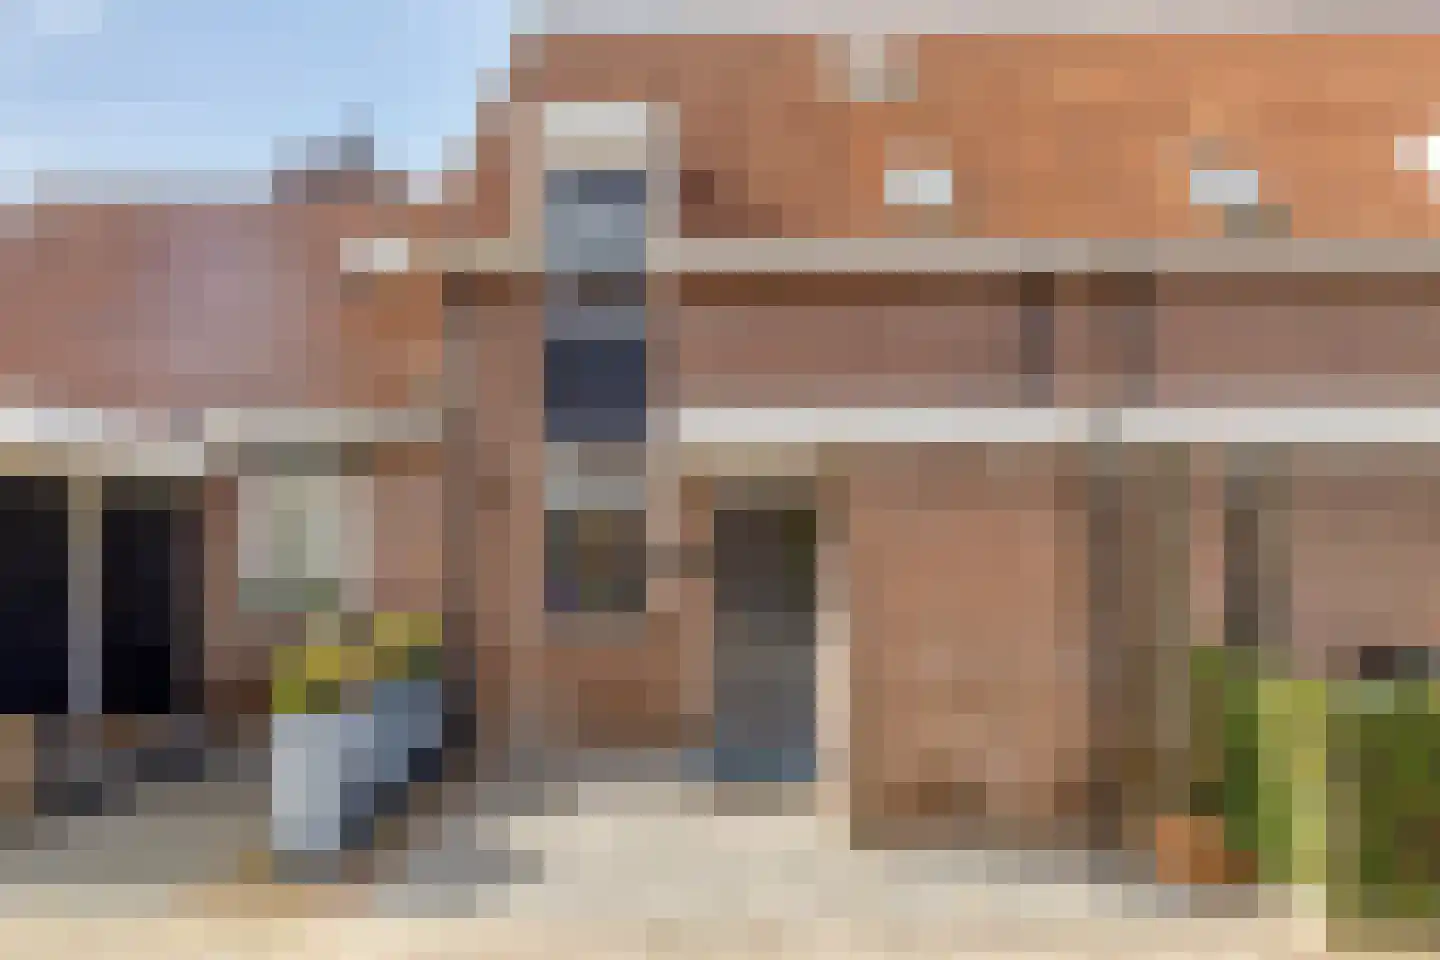
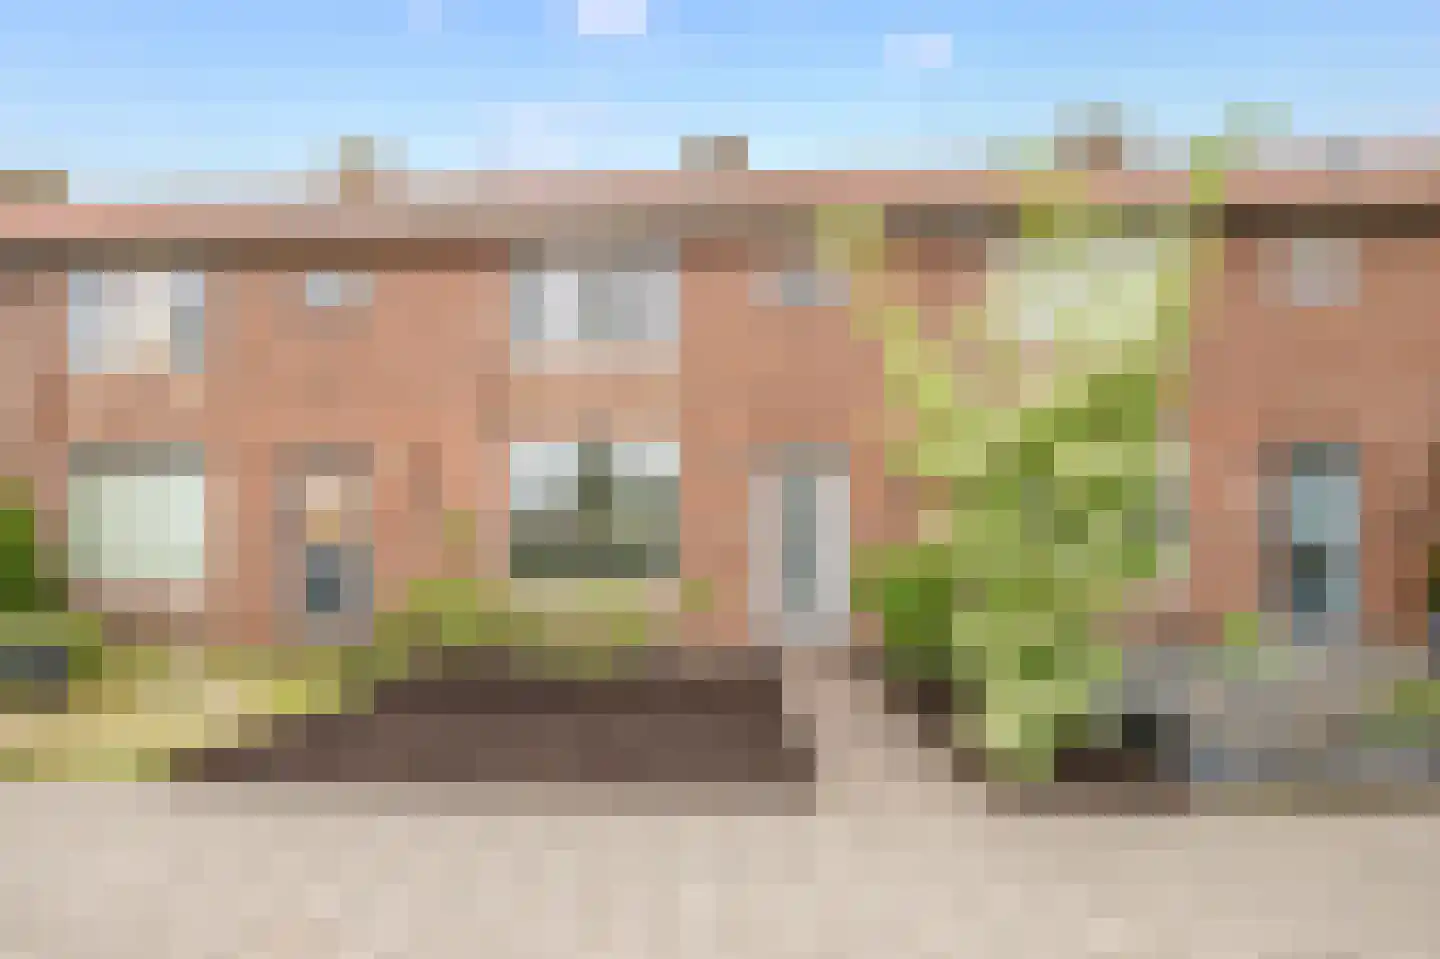
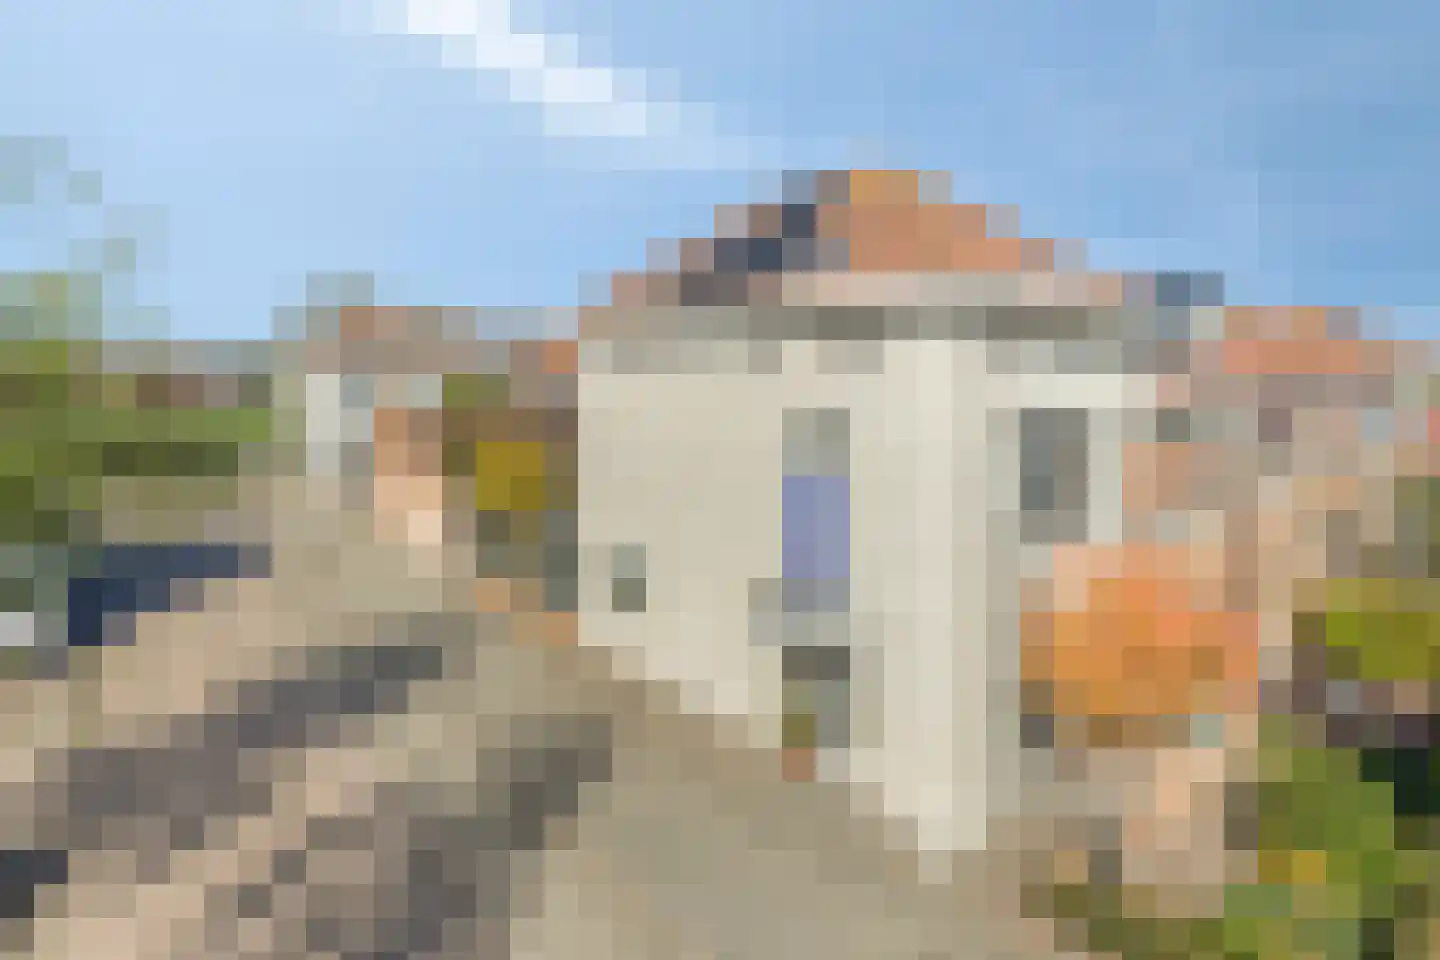
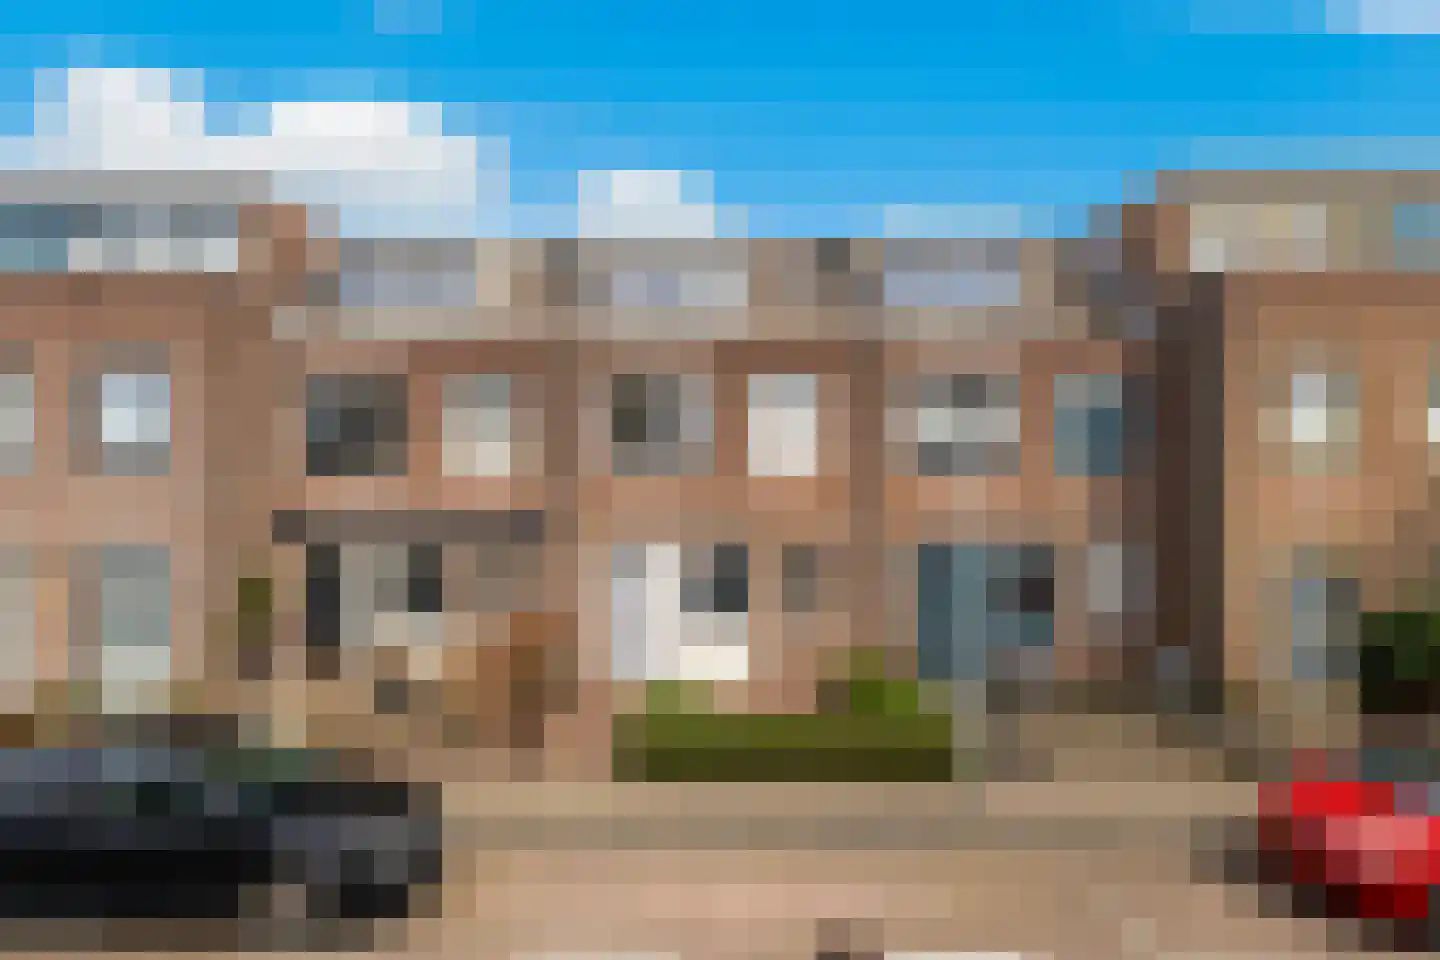
Aan de Snippendreef 30 in Stolwijk staat deze tussenwoning met vier slaapkamers, een lichte woonkamer, open keuken en een zonnige achtertuin op het zuidwesten aan het water. Een fijne gezinswoning op een prettige locatie in een kindvriendelijke woonwijk, met de polder om de hoek en voorzieningen zoals scholen, winkels en sportverenigingen op korte afstand. Bij binnenkomst valt direct op dat deze woning meer ruimte biedt dan de voorzijde doet vermoeden. Via de entree kom je in de lichte woonkamer met open keuken. De keuken is aan de voorzijde van de woning geplaatst en ingericht in een praktische L-opstelling. Daarbij is deze voorzien van diverse inbouwapparatuur. De woonkamer is prettig van formaat en dankzij de openslaande deuren naar de tuin is er een fijne verbinding tussen binnen en buiten. De achtertuin vormt een groot pluspunt van deze woning. Deze is gelegen op het zuidwesten, grenst aan een brede sloot en biedt daarmee een fijne, vrije ligging. De tuin is grotendeels betegeld, voorzien van diverse borders en een vlonder aan het water. Aan de achterzijde van de woning is bovendien zonwering aanwezig. Op de eerste verdieping bevinden zich drie slaapkamers en de badkamer. De ruime slaapkamer aan de achterzijde beschikt over extra bergruimte, wat zorgt voor extra praktisch gemak. De badkamer is volledig betegeld en ingericht met een ligbad, douchecabine, toilet en wastafel met meubel. Ook de tweede verdieping is een volwaardige woonlaag. Hier vind je een ruime voorzolder met wasmachineaansluiting en de vierde slaapkamer. Ook deze slaapkamer beschikt over extra bergruimte aan zowel de voor als achterzijde. De woning is uitgevoerd met houten en kunststof kozijnen met dubbele beglazing. De verwarming en het warme water worden verzorgd door een Nefit cv installatie uit 2019. Op de begane grond is, met uitzondering van het toilet, vloerverwarming aanwezig in combinatie met radiatoren. De ligging in Stolwijk maakt het geheel extra aantrekkelijk. Je woont hier rustig, met het buitengebied en de polder op steenworp afstand, terwijl ook grotere plaatsen als Gouda en Rotterdam goed bereikbaar zijn. Gouda ligt op circa 15 autominuten en Rotterdam op circa 35 autominuten.
€ 450.000
Cost of copper (estimated): € 10.850
2% transfer tax (€ 9.000) + notary (€ 1.150) + valuation (€ 700)
Total purchase (incl. p.p.): € 460.850
3,02%
Yearly
€ 22.500
Direct available
Estimated mortgage
Indicative gross monthly cost
Based on annuity and 30 year term
Indicative net monthly cost
iDisclaimer: this mortgage calculation is a simplified indication based on general assumptions. No rights can be derived from the results shown. Calculated with 10-annual interest (met NHG), automatically determined based on the price limit € 470.000. Source: 10-jaars rente uit mortgage_rates (07-06-2026 03:45).
Douche, ligbad, toilet, wastafel, en wastafelmeubel
Discover where agents are active in Stolwijk
View current location data on residents, WOZ development, housing stock, energy consumption, business activity and safety in Stolwijk. In 2025 were there 5.440 residents. The average WOZ value in 2025 is EUR 473.000.
Residents
5.440
Last year: 2025
Average WOZ
EUR 473.000
Last year: 2025
Average income per person.
EUR 34.600
Source: AllNumbers
Crimes (current year)
107
Total registered
| Year | Residents |
|---|---|
| 2021 | 5.300 |
| 2022 | 5.420 |
| 2023 | 5.465 |
| 2024 | 5.440 |
| 2025 | 5.440 |
| Year | Average WOZ |
|---|---|
| 2021 | EUR 340.000 |
| 2022 | EUR 380.000 |
| 2023 | EUR 441.000 |
| 2024 | EUR 468.000 |
| 2025 | EUR 473.000 |
Hoger
1.420
Praktisch
880
Middelbaar
1.560
Europa
145
Nederland
4.940
Buiten Europa
350
Label A
475
Label C
456
Label B
317
Label G
284
Label D
199
Label A+++
105
Label E
89
Label F
79
Label A++++
44
Label A+
23
Label A++
9
Label A+++++
0
| Year | Gas (m3) | Electricity (kWh) |
|---|---|---|
| 2020 | 1.320 | 3.070 |
| 2021 | 1.490 | 3.100 |
| 2022 | 1.140 | 2.970 |
| 2023 | 960 | 2.860 |
| 2024 | 930 | 2.920 |
Hoekwoning
Gas: 900 • Electricity: 2.560
Huurwoning
Gas: 760 • Electricity: 2.030
Koopwoning
Gas: 1.040 • Electricity: 3.180
Appartement
Gas: 670 • Electricity: 1.850
Tussenwoning
Gas: 780 • Electricity: 2.340
Vrijstaande woning
Gas: 1.350 • Electricity: 4.120
Twee-onder-één-kap woning
Gas: 1.040 • Electricity: 3.160
Total number of company establishments: 795
| Period | Crimes |
|---|---|
| jan 2025 | 15 |
| jan 2026 | 3 |
| jul 2025 | 9 |
| jun 2025 | 6 |
| mei 2025 | 4 |
| mrt 2025 | 14 |
| nov 2024 | 11 |
| nov 2025 | 5 |
| okt 2024 | 14 |
| okt 2025 | 8 |
| sep 2024 | 4 |
| sep 2025 | 10 |
These figures give an indicative picture of safety trends in the living environment of Stolwijk.
Short answers based on current local statistics, handy for a quick comparison of the living environment.
Stolwijk telt in 2025 ongeveer 5.440 inwoners.
De gemiddelde WOZ-waarde in Stolwijk is in 2025 circa € 473.000.
Het gemiddelde inkomen per inwoner in Stolwijk ligt rond € 34.600 per jaar.
Voor het huidige jaar gaat het om ongeveer 107 geregistreerde misdrijven. Gebruik deze cijfers als indicatie en vergelijk trends per periode.
In Stolwijk komt vooral "Tussenwoningen" veel voor, met ongeveer 617 woningen.
View more homes in this location.
2821TG Stolwijk
€ 465.000 k.k.
€ 4.346/m²
2821VZ Stolwijk
€ 475.000 k.k.
€ 3.442/m²
2821SC Stolwijk
€ 389.000 k.k.
€ 4.987/m²

2821ND Stolwijk
€ 1.380.000 k.k.
€ 3.053/m²

2821BG Stolwijk
€ 670.000 k.k.
2821ZM Stolwijk
€ 550.000 k.k.
2821ZD Stolwijk
€ 445.000 k.k.
€ 3.771/m²

2821SK Stolwijk
€ 985.000 k.k.
€ 5.353/m²
