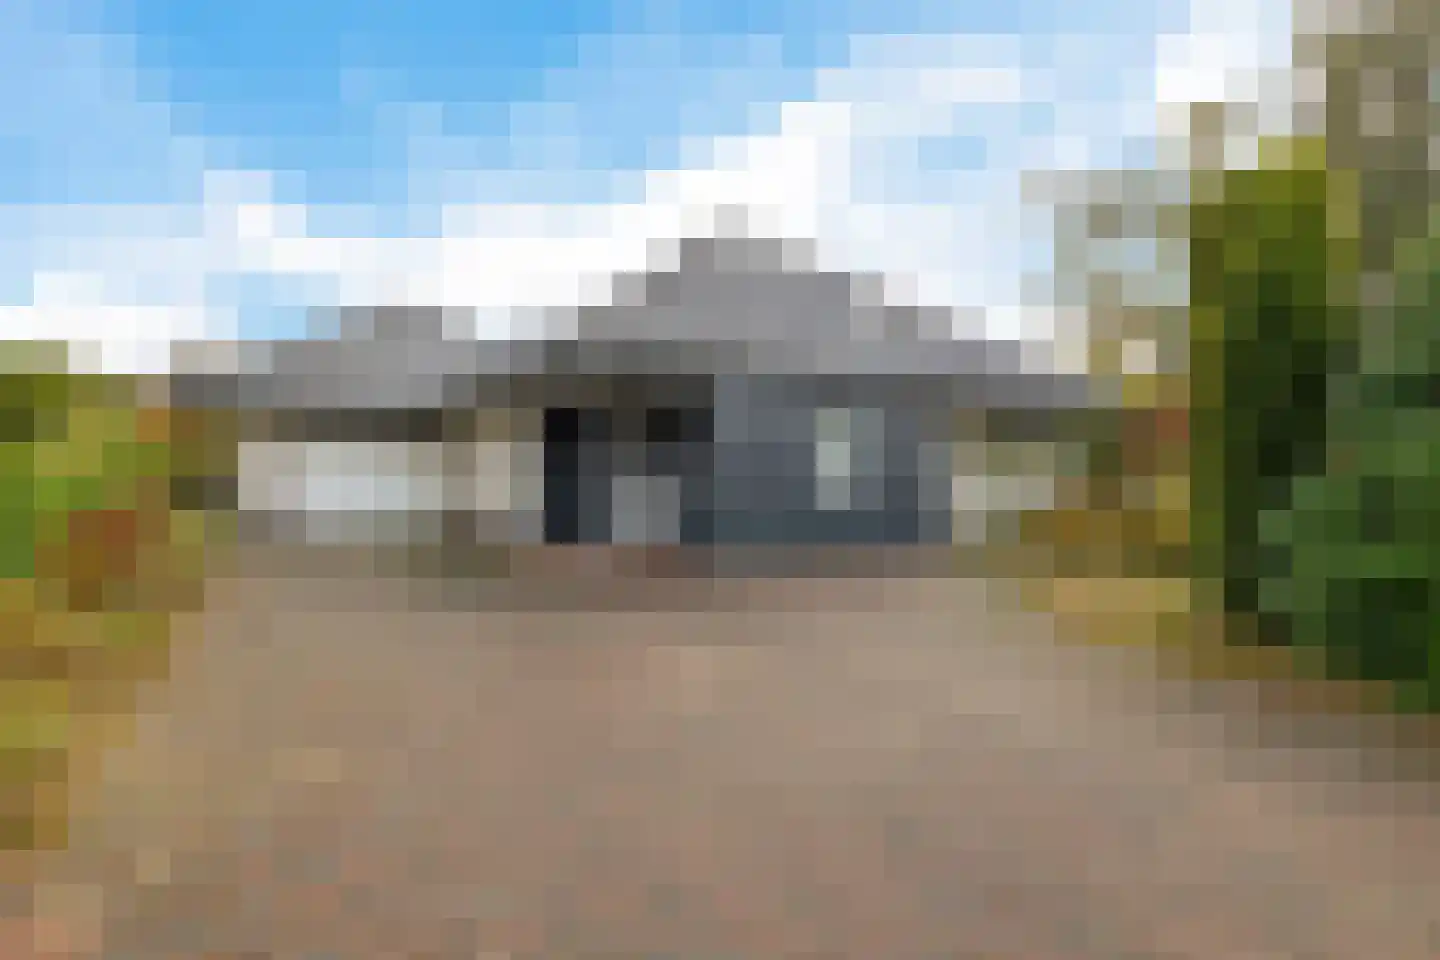
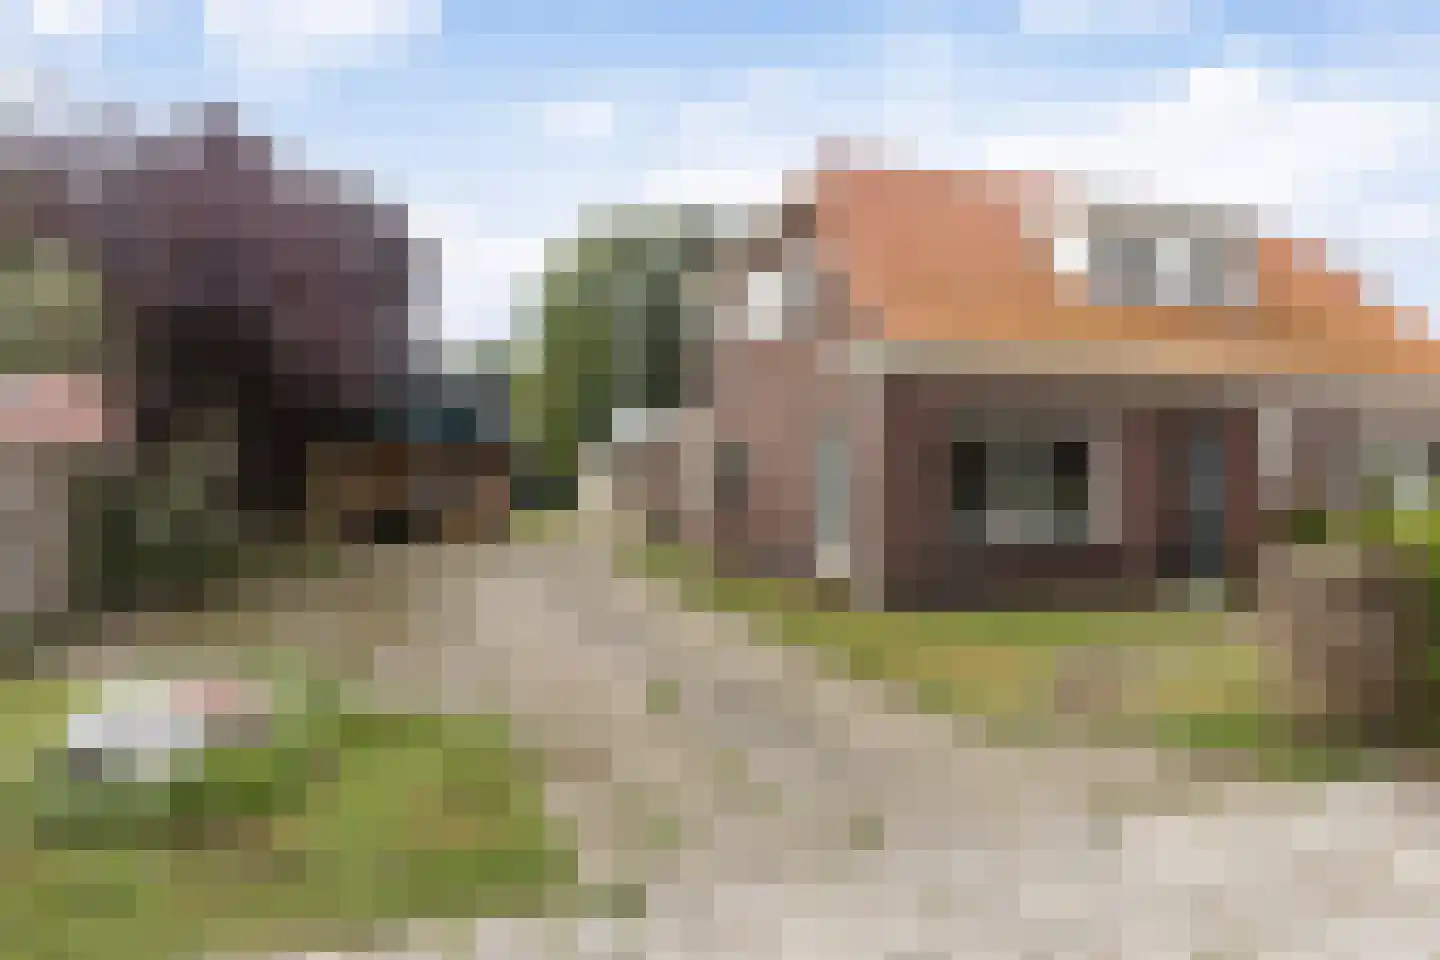
Houses sold in Ter Apel

View 58 sold houses in Ter Apel

Connected to: Vastgoed Nederland NVM Makelaars

On this page you will find recently sold homes in Ter Apel. Use this overview to better estimate selling prices, popular neighborhoods, and the local housing supply before you choose a real estate agent. Also view the current housing supply with 81 houses in Ter Apel.

Selection

Search and filter homes

Set your preferences and discover homes that suit you.

Total supply 242.822
Filters

Set price, area and other characteristics. Adjust a filter or click on Show homes. Location changes directly above.

Reset filters

You search for

  • Place Ter Apel
  • Status Sold

Sell your house in Ter Apel? Compare real estate agents

View recent sales and receive free quotes from local real estate agents. Compare more than 18 real estate agents in Ter Apel.

Free request a quote

  • Quotes in Ter Apel
  • Non-binding
  • Personal
  • Compare free rates

Sold recently in Ter Apel? Read the sales-oriented guide sell your home in Ter Apel, compare sales agents in Ter Apel or view the top sales agents in Ter Apel for reference in your choice.

Compare multiple quotes

Real estate agents make sharper offers when they know you're comparing — ask for quotes for sale or purchase.

Frequently asked questions about sold homes in Ter Apel

Short answers about housing prices, sold homes and comparing real estate agents in Ter Apel.

Residential and neighborhood statistics in Ter Apel

View current location data on residents, WOZ development, housing stock, energy consumption, business activity and safety in Ter Apel. In 2025 were there 10.759 residents. The average WOZ value in 2025 is EUR 241.602.

These figures help to better assess and compare the housing stock in Ter Apel with recent sold homes. Orient yourself then on suitable top real estate agents in Ter Apel for sales advice in this region.

Residents

10.759

Last year: 2025

Average WOZ

EUR 241.602

Last year: 2025

Average income per person.

EUR 11.656

Source: AllNumbers

Crimes (current year)

743

Total registered

Demographics and WOZ development

Inhabitants per year

Inhabitants per year in Ter Apel
Year Residents
2021 9.779
2022 10.123
2023 9.908
2024 9.840
2025 10.759

Annual WOZ value

WOZ value per year in Ter Apel
Year Average WOZ
2021 EUR 172.888
2022 EUR 199.954
2023 EUR 231.175
2024 EUR 243.049
2025 EUR 241.602

Composition of residents

Age build-up

65+: 2.379 0-15: 1.765 15-25: 1.696 25-45: 2.305 45-65: 2.608

Education level

Hoger

768

Praktisch

1.838

Middelbaar

2.697

Origin of residents (2025)

Europa

476

Nederland

7.442

Buiten Europa

2.831

Housing stock and construction periods

Types of homes

Hoekwoningen 425
Appartementen 1.173
Tussenwoningen 615
Vrijstaande woningen 1.433
Twee-onder-één-kap woningen 738

Construction period of buildings

Voor 1700 2
1700 tot 1900 8
1900 tot 1925 322
1925 tot 1950 669
1950 tot 1970 868
1970 tot 1980 581
1980 tot 1990 338
1990 tot 2000 429
2000 tot 2010 193
2010 tot 2020 158
2020 en later 94

Energy and sustainability

Energy label distribution

Label A

1.043

Label C

842

Label B

750

Label G

589

Label D

531

Label F

308

Label E

195

Label A+

34

Label A+++

34

Label A++

25

Label A++++

13

Label A+++++

2

Average energy consumption per year

Average energy consumption per year in Ter Apel
Year Gas (m3) Electricity (kWh)
2020 1.541 3.091
2021 1.738 3.090
2022 1.376 2.955
2023 1.132 2.793
2024 1.070 2.917

Consumption per house type

Hoekwoning

Gas: 786 • Electricity: 1.600

Huurwoning

Gas: 986 • Electricity: 1.995

Koopwoning

Gas: 1.185 • Electricity: 3.137

Appartement

Gas: 869 • Electricity: 1.619

Tussenwoning

Gas: 693 • Electricity: 1.594

Vrijstaande woning

Gas: 1.303 • Electricity: 3.473

Twee-onder-één-kap woning

Gas: 954 • Electricity: 2.409

Business activity in Ter Apel (2025)

Handel en HORECA 187
Nijverheid en energie 199
Zakelijke dienstverlening 136
Overheid, onderwijs en zorg 119
Landbouw, bosbouw en visserij 53
Vervoer, informatie en communicatie 31
Financiele diensten en onroerendgoed 45
Cultuur, recreatie en overige diensten 96

Total number of company establishments: 919

Recent crime statistics

Recent crime statistics in Ter Apel
Period Crimes
jan 2025 49
jan 2026 92
jul 2025 85
jun 2025 46
mei 2025 56
mrt 2025 57
nov 2024 48
nov 2025 91
okt 2024 58
okt 2025 73
sep 2024 52
sep 2025 65

These figures give an indicative picture of safety trends in the living environment of Ter Apel.

Frequently asked questions about living in Ter Apel

Short answers based on current local statistics, handy for a quick comparison of the living environment.

Hoeveel inwoners heeft Ter Apel?

Ter Apel telt in 2025 ongeveer 10.759 inwoners.

Wat is de gemiddelde WOZ-waarde in Ter Apel?

De gemiddelde WOZ-waarde in Ter Apel is in 2025 circa € 241.602.

Wat is het gemiddelde inkomen per inwoner in Ter Apel?

Het gemiddelde inkomen per inwoner in Ter Apel ligt rond € 11.656 per jaar.

Hoe veilig is wonen in Ter Apel?

Voor het huidige jaar gaat het om ongeveer 743 geregistreerde misdrijven. Gebruik deze cijfers als indicatie en vergelijk trends per periode.

Welke woningtypen komen het meest voor in Ter Apel?

In Ter Apel komt vooral "Vrijstaande woningen" veel voor, met ongeveer 1.433 woningen.

Receive free, non-binding quotes

Compare multiple real estate agents and choose the best match.