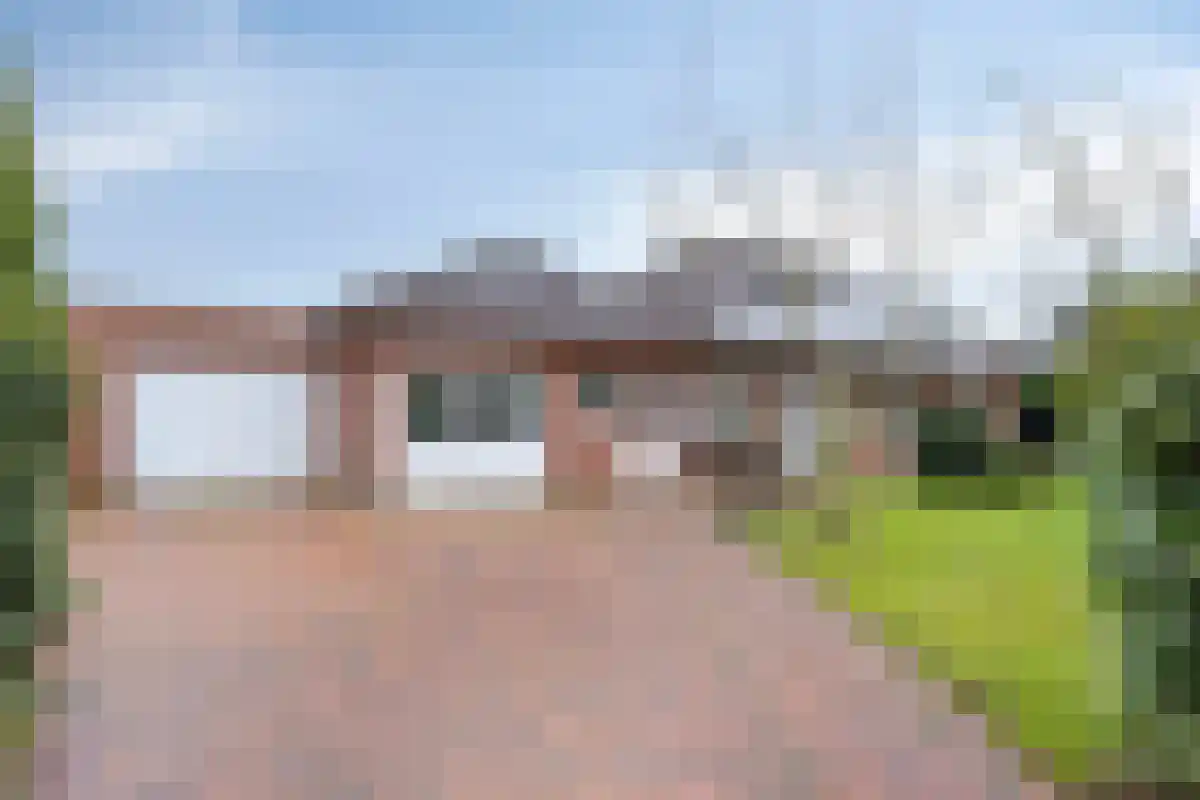
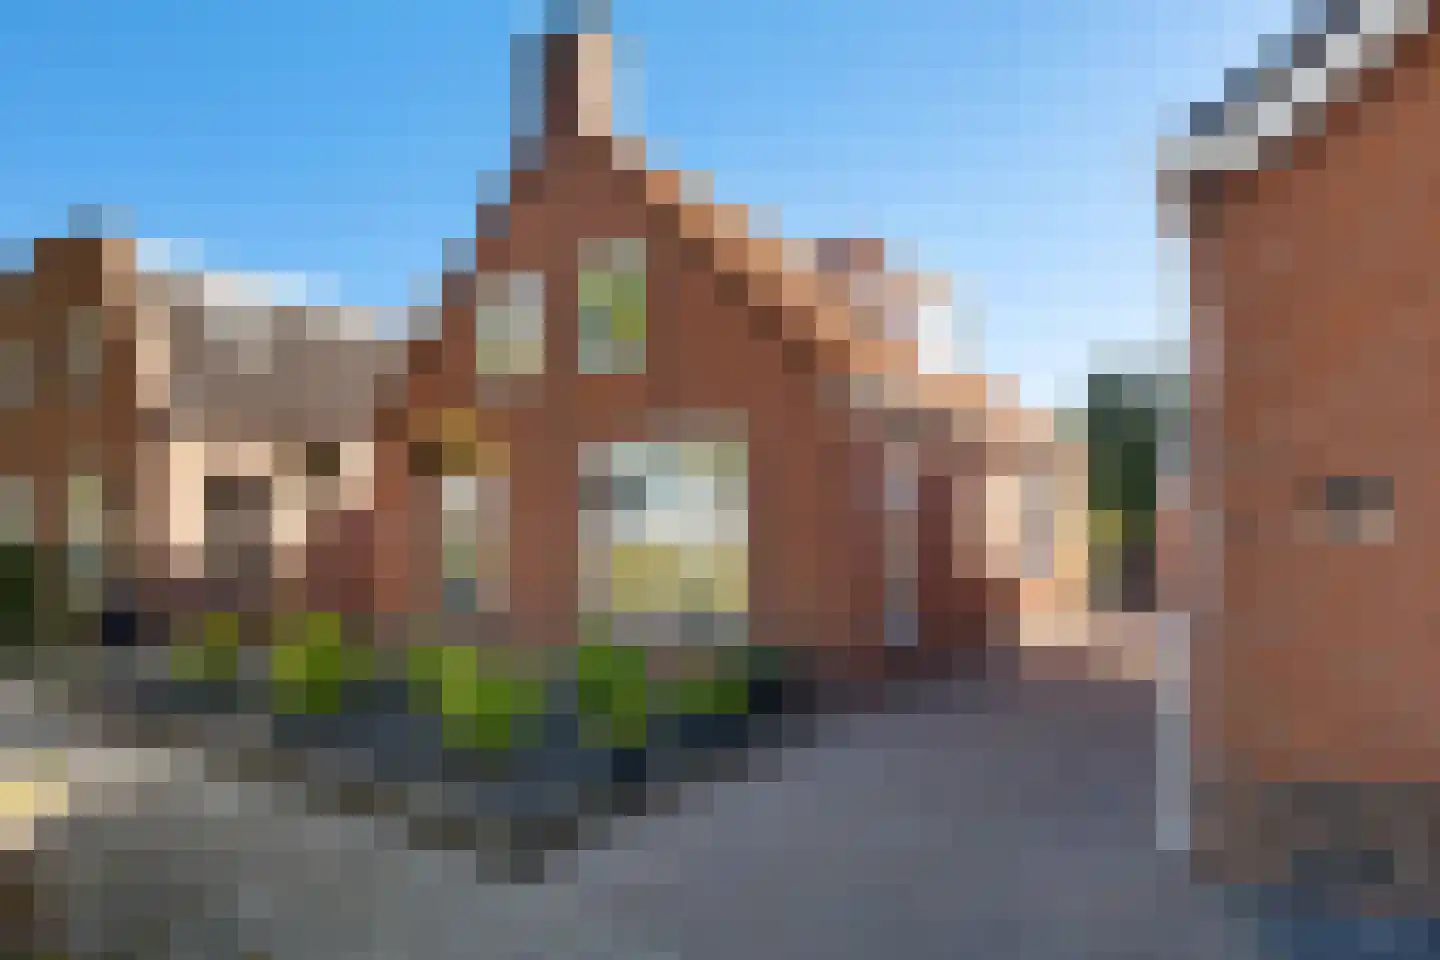
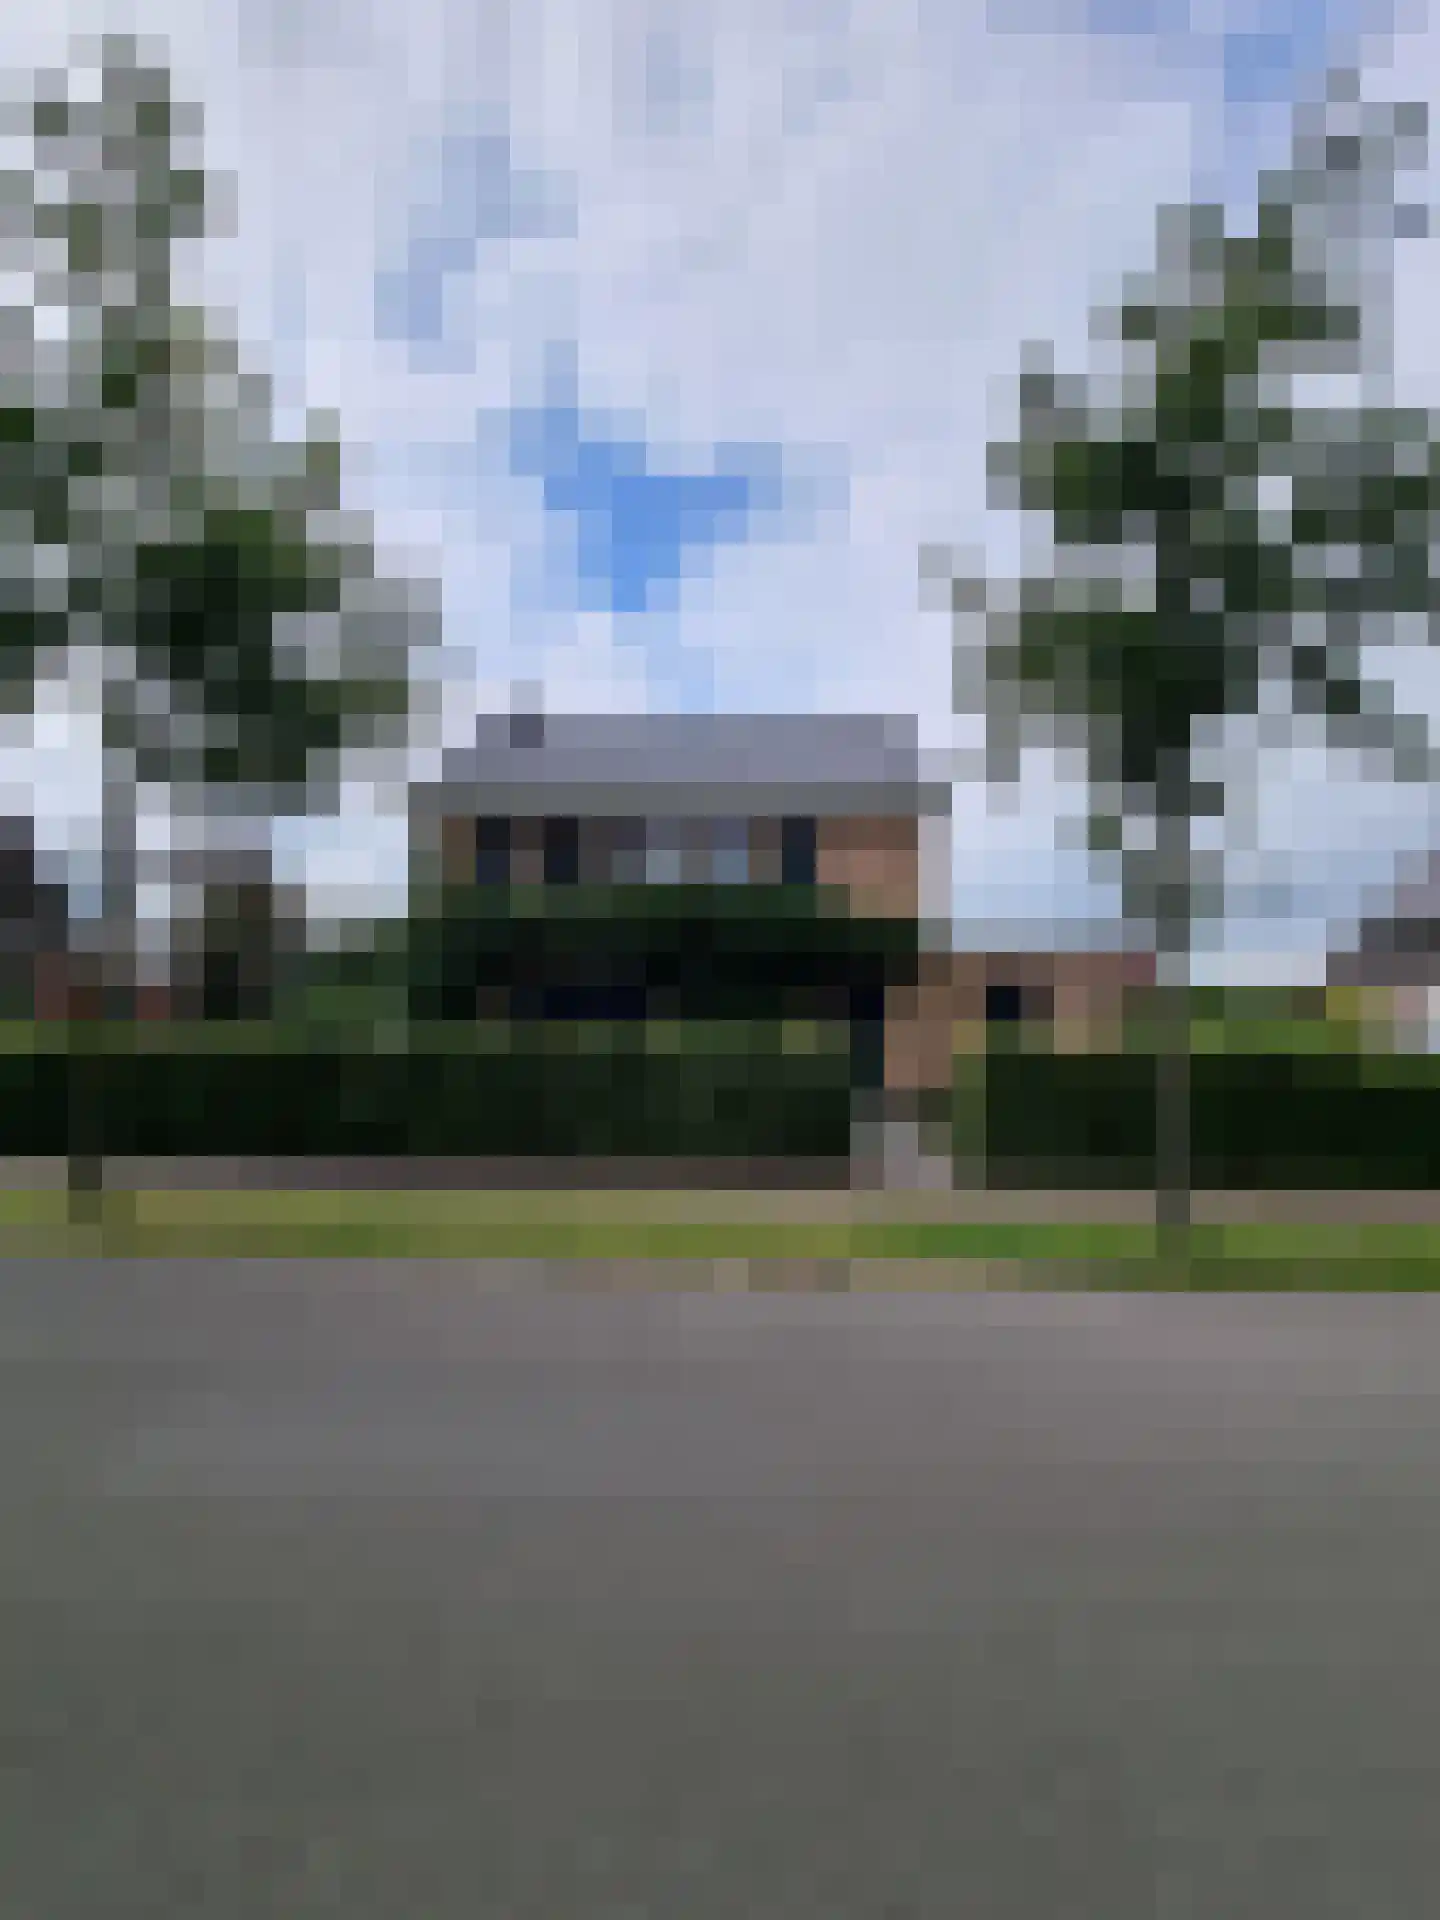
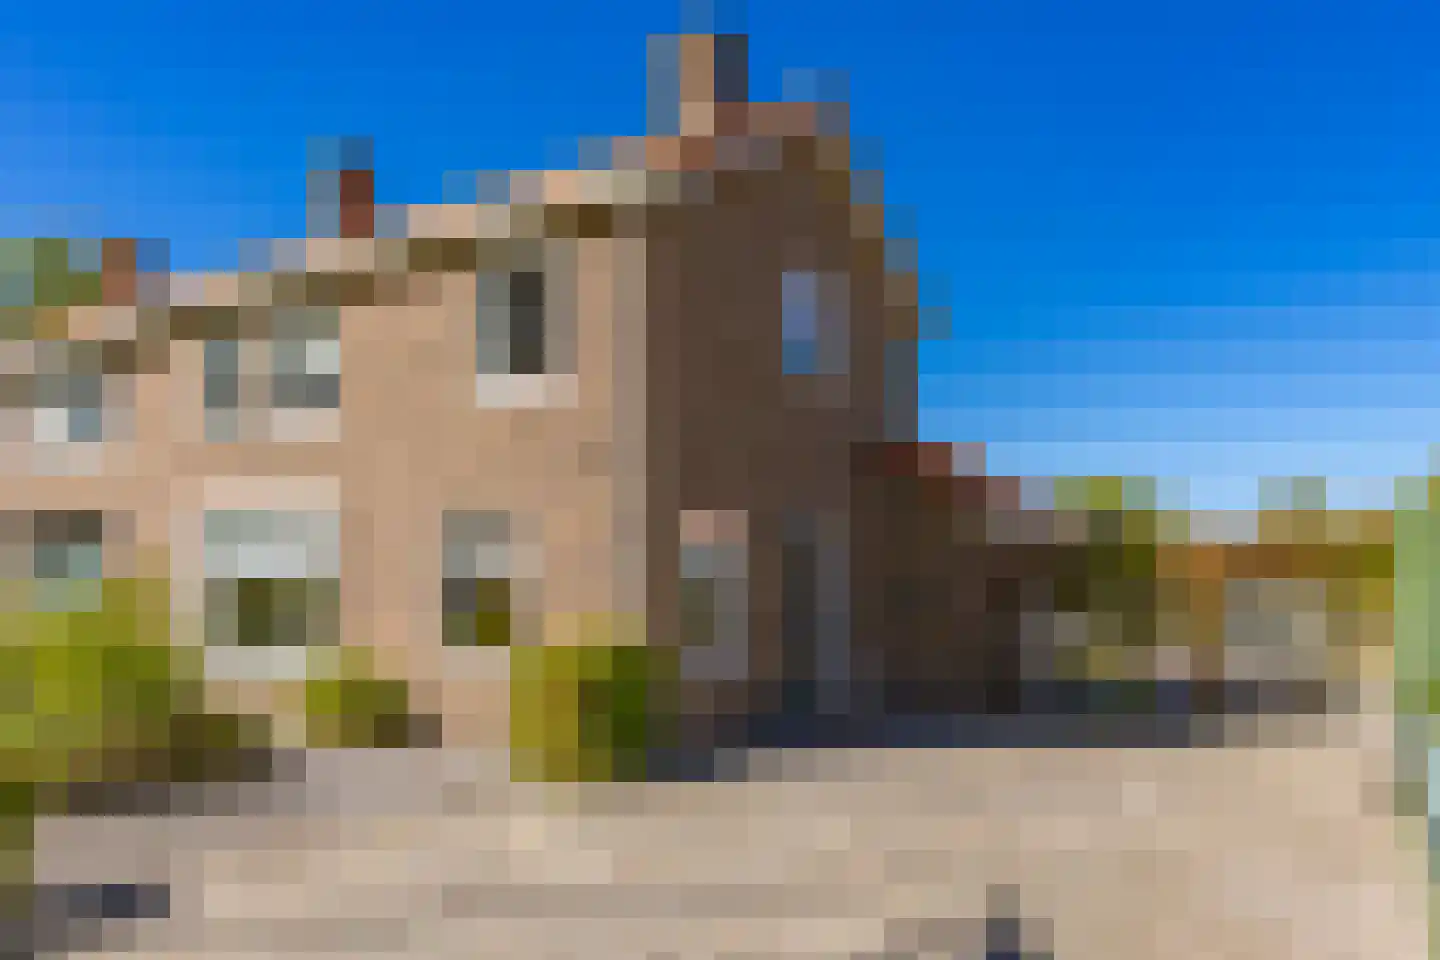
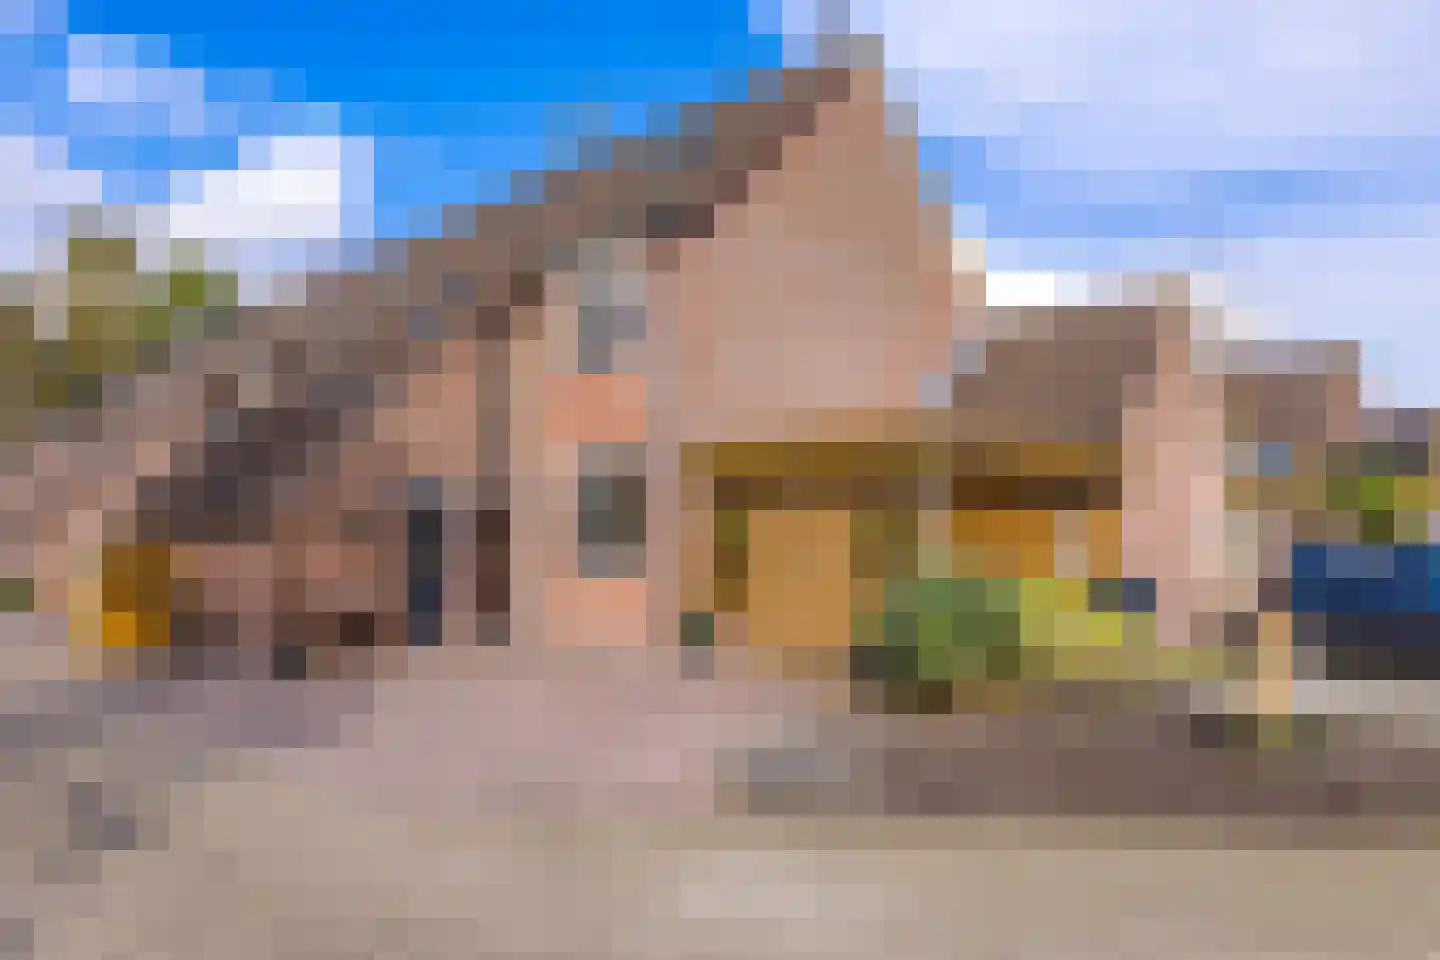
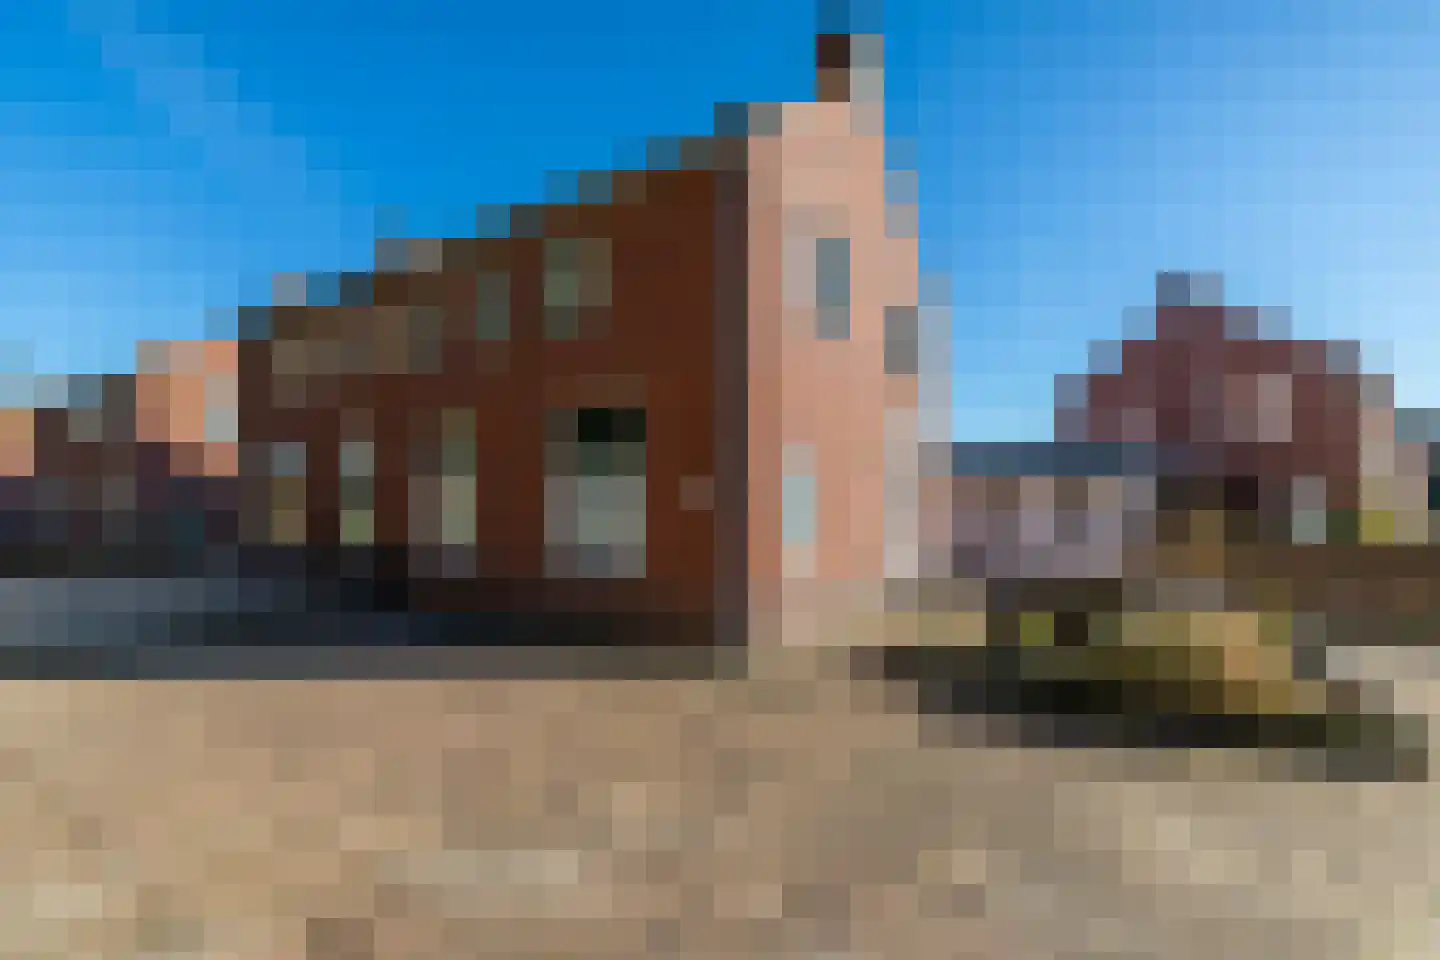
- Available
Reigerhof 23
9561CH Ter Apel
€ 399.500 k.k.
€ 2.594/m²
- Living area
- 154 m²
- Land area
- 362 m²
- Bedrooms
- 5
Searching in 82 houses in Ter Apel
Type to search. Use arrow down and arrow up to navigate through results and press Enter to open.
Hidden search suggestions.
View current properties in Ter Apel or search targeted on street, postal code and property characteristics.
View the current housing stock in Ter Apel and quickly filter by price, living area, rooms and more. There are currently 82 houses in this place within our selection. View also 58 sold houses in Ter Apel for extra insight into the local housing market.
9561CH Ter Apel
€ 399.500 k.k.
€ 2.594/m²
9561GJ Ter Apel
€ 295.000 k.k.
€ 2.398/m²
9561AB Ter Apel
€ 389.500 k.k.
€ 2.404/m²
9561RT Ter Apel
€ 249.000 k.k.
€ 2.649/m²
9561PL Ter Apel
€ 459.000 k.k.
€ 2.799/m²
9561TK Ter Apel
€ 449.000 k.k.
€ 1.919/m²
9561PA Ter Apel
€ 397.500 k.k.
€ 3.487/m²
9561AA Ter Apel
€ 475.000 k.k.
€ 3.958/m²
9561AG Ter Apel
€ 521.000 k.k.
€ 4.378/m²
9561PL Ter Apel
€ 275.000 k.k.
€ 2.957/m²
9561JW Ter Apel
€ 625.000 k.k.
9561JD Ter Apel
€ 499.000 k.k.
€ 3.240/m²
9561DA Ter Apel
€ 275.000 k.k.
€ 1.964/m²
9561KD Ter Apel
€ 389.000 k.k.
€ 2.881/m²
9561HB Ter Apel
€ 425.000 k.k.
€ 3.220/m²
9561JG Ter Apel
€ 825.000 k.k.
€ 2.492/m²
9561CS Ter Apel
€ 249.500 k.k.
€ 2.062/m²
9561JH Ter Apel
€ 325.000 k.k.
€ 2.876/m²
9561AS Ter Apel
€ 415.000 k.k.
€ 3.294/m²
9561KA Ter Apel
€ 269.000 k.k.
€ 2.468/m²
9561TP Ter Apel
€ 650.000 k.k.
€ 3.779/m²
9561AN Ter Apel
€ 975.000 k.k.
€ 4.514/m²
9561HB Ter Apel
€ 219.500 k.k.
9561NN Ter Apel
€ 339.500 k.k.
€ 1.918/m²
9561DS Ter Apel
€ 315.000 k.k.
€ 2.188/m²
9561SZ Ter Apel
€ 347.500 k.k.
€ 2.673/m²
9561LS Ter Apel
€ 225.000 k.k.
€ 2.679/m²
9561KA Ter Apel
€ 249.000 k.k.
€ 2.306/m²
Get free quotes from real estate agents with local market knowledge. Compare more than 18 real estate agents in Ter Apel.
Selling a home in Ter Apel? View the sales-oriented guide sell a house in Ter Apel, compare all real estate agents in Ter Apel or view the top 10 real estate agents in Ter Apel for extra context to your choice.
Real estate agents make sharper offers when they know you're comparing — ask for quotes for sale or purchase.
Practical answers about housing supply, sales and comparing real estate agents in Ter Apel.
The costs of a real estate agent in Ter Apel depend on commission, setup costs, property presentation and the chosen service. Compare the 18 real estate agents in Ter Apel via the real estate agent page and request multiple quotes to compare rates and approach well.
Within our selection, we are currently showing 82 houses in Ter Apel. View also the sold houses in Ter Apel to compare the current offering with recent transactions.
Take into account not only price and living area but also maintenance, energy label, location, outdoor space and sales status. This way you compare houses in Ter Apel on more than just the asking price.
A local real estate agent knows the neighborhoods, recent transactions and demand in Ter Apel. By comparing 18 real estate agents in the region you get a better insight into prices, sales strategy and expected yield; the top 10 in Ter Apel provides a useful starting point.
Yes, when making a sales plan, a valuation in Ter Apel is wise. You gain insight into a realistic asking price and can then compare offers from real estate agents specifically.
View current location data on residents, WOZ development, housing stock, energy consumption, business activity and safety in Ter Apel. In 2025 were there 10.759 residents. The average WOZ value in 2025 is EUR 241.602.
These figures help to better assess and compare the housing stock in Ter Apel with recent sold homes. Orient yourself then on suitable top real estate agents in Ter Apel for sales advice in this region.
Residents
10.759
Last year: 2025
Average WOZ
EUR 241.602
Last year: 2025
Average income per person.
EUR 11.656
Source: AllNumbers
Crimes (current year)
743
Total registered
| Year | Residents |
|---|---|
| 2021 | 9.779 |
| 2022 | 10.123 |
| 2023 | 9.908 |
| 2024 | 9.840 |
| 2025 | 10.759 |
| Year | Average WOZ |
|---|---|
| 2021 | EUR 172.888 |
| 2022 | EUR 199.954 |
| 2023 | EUR 231.175 |
| 2024 | EUR 243.049 |
| 2025 | EUR 241.602 |
Hoger
768
Praktisch
1.838
Middelbaar
2.697
Europa
476
Nederland
7.442
Buiten Europa
2.831
Label A
1.043
Label C
842
Label B
750
Label G
589
Label D
531
Label F
308
Label E
195
Label A+
34
Label A+++
34
Label A++
25
Label A++++
13
Label A+++++
2
| Year | Gas (m3) | Electricity (kWh) |
|---|---|---|
| 2020 | 1.541 | 3.091 |
| 2021 | 1.738 | 3.090 |
| 2022 | 1.376 | 2.955 |
| 2023 | 1.132 | 2.793 |
| 2024 | 1.070 | 2.917 |
Hoekwoning
Gas: 786 • Electricity: 1.600
Huurwoning
Gas: 986 • Electricity: 1.995
Koopwoning
Gas: 1.185 • Electricity: 3.137
Appartement
Gas: 869 • Electricity: 1.619
Tussenwoning
Gas: 693 • Electricity: 1.594
Vrijstaande woning
Gas: 1.303 • Electricity: 3.473
Twee-onder-één-kap woning
Gas: 954 • Electricity: 2.409
Total number of company establishments: 919
| Period | Crimes |
|---|---|
| jan 2025 | 49 |
| jan 2026 | 92 |
| jul 2025 | 85 |
| jun 2025 | 46 |
| mei 2025 | 56 |
| mrt 2025 | 57 |
| nov 2024 | 48 |
| nov 2025 | 91 |
| okt 2024 | 58 |
| okt 2025 | 73 |
| sep 2024 | 52 |
| sep 2025 | 65 |
These figures give an indicative picture of safety trends in the living environment of Ter Apel.
Short answers based on current local statistics, handy for a quick comparison of the living environment.
Ter Apel telt in 2025 ongeveer 10.759 inwoners.
De gemiddelde WOZ-waarde in Ter Apel is in 2025 circa € 241.602.
Het gemiddelde inkomen per inwoner in Ter Apel ligt rond € 11.656 per jaar.
Voor het huidige jaar gaat het om ongeveer 743 geregistreerde misdrijven. Gebruik deze cijfers als indicatie en vergelijk trends per periode.
In Ter Apel komt vooral "Vrijstaande woningen" veel voor, met ongeveer 1.433 woningen.