- Sold subject to confirmation
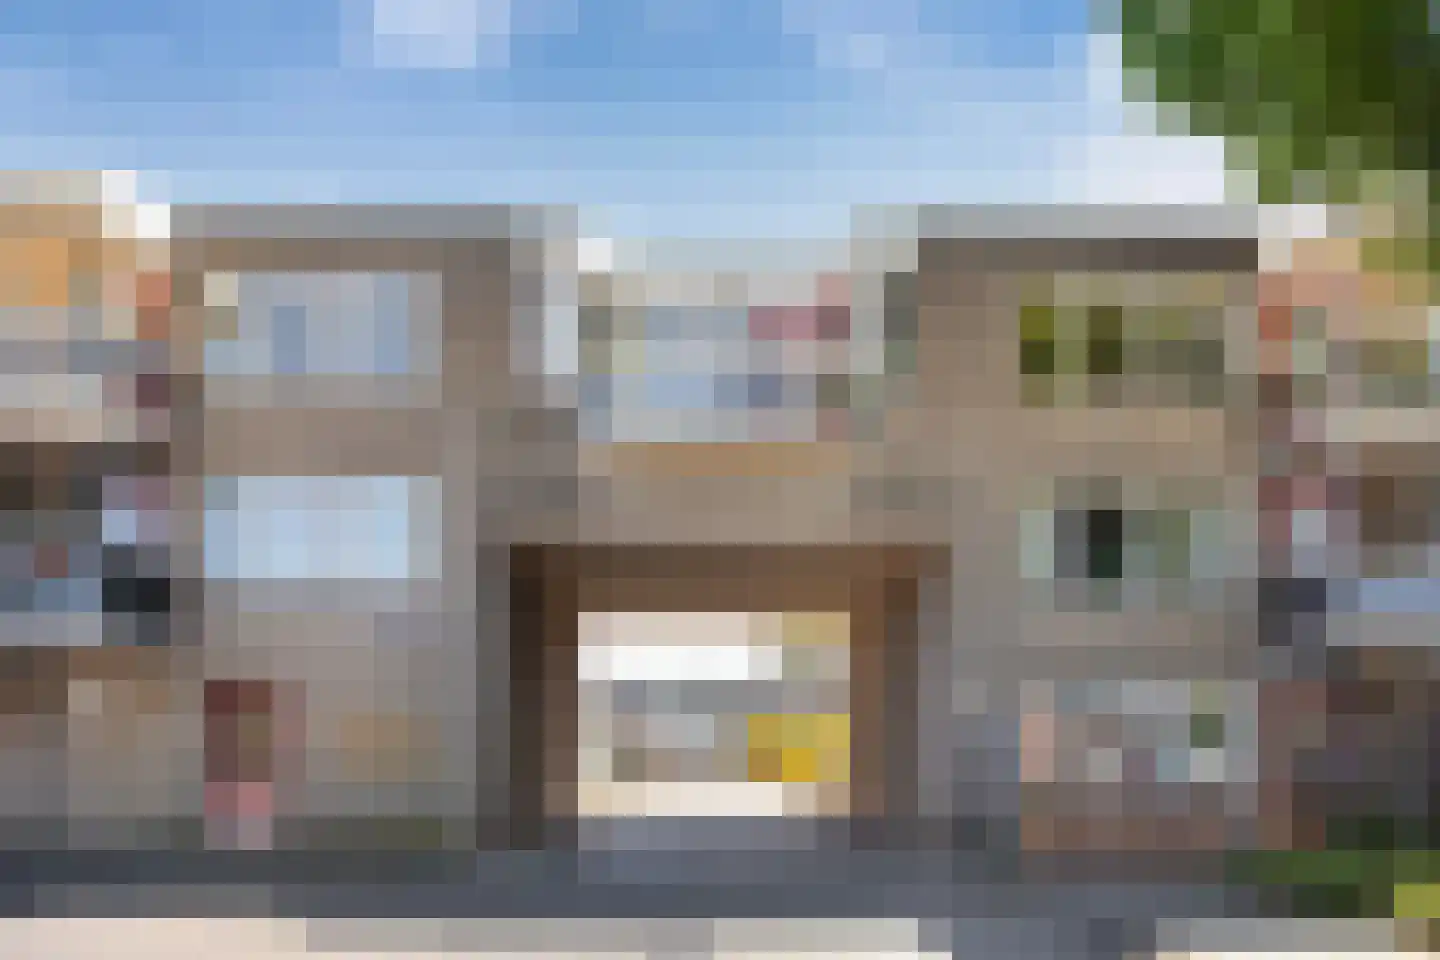
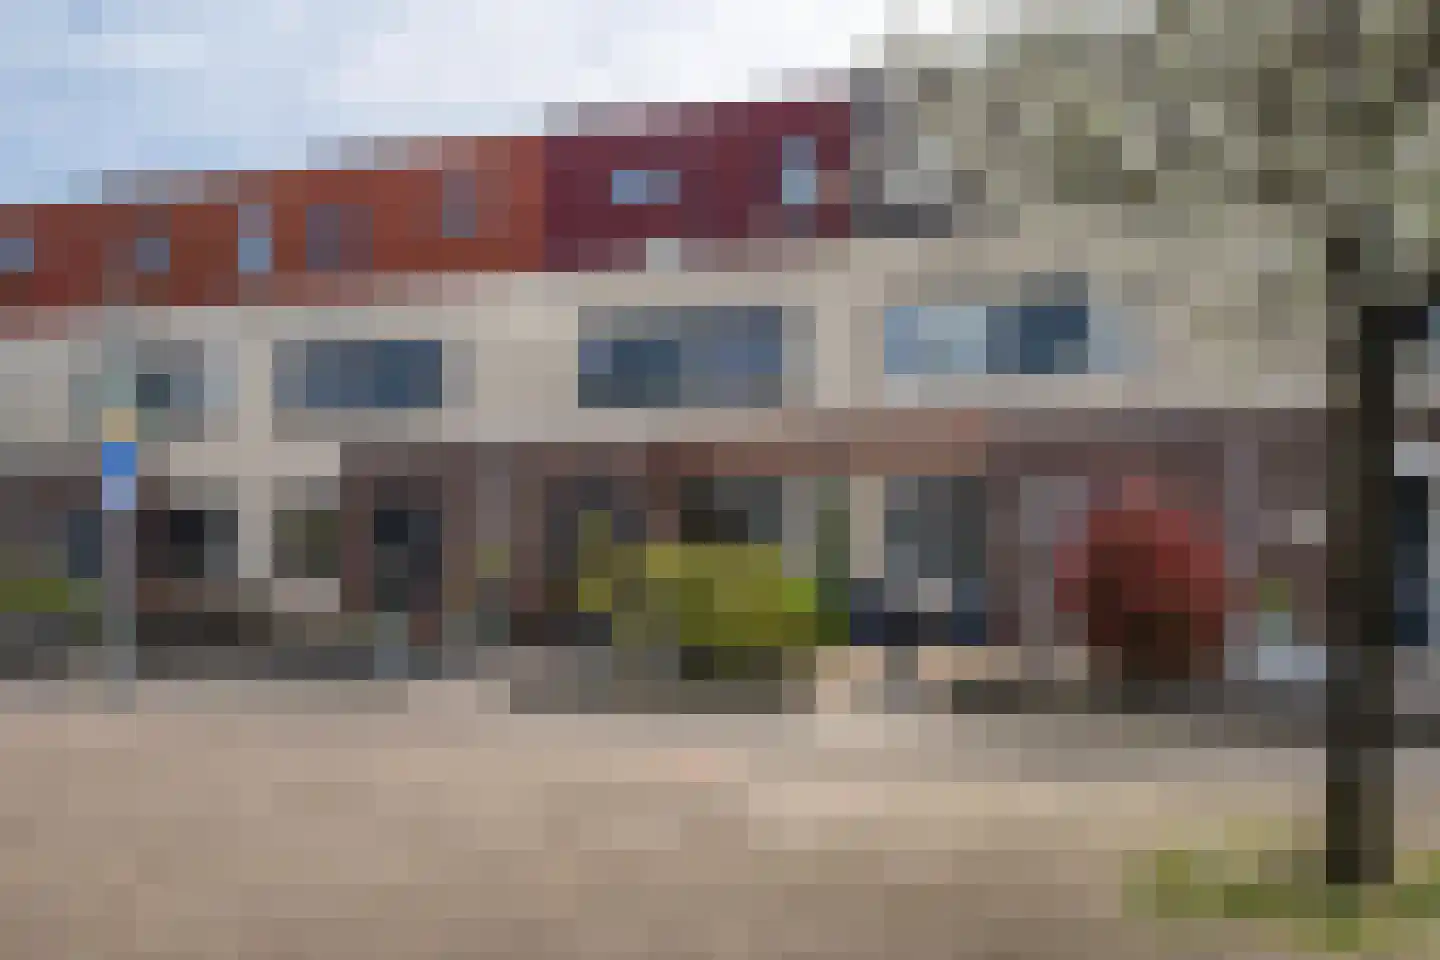
Hoveniersweg 63
4001HS Tiel
€ 425.000 k.k.
€ 4.208/m²
- Living area
- 101 m²
- Land area
- 216 m²
- Bedrooms
- 3
Searching in 533 houses in Tiel
Type to search. Use arrow down and arrow up to navigate through results and press Enter to open.
Hidden search suggestions.
View current properties in Tiel or search targeted on street, postal code and property characteristics.
View the current housing stock in Tiel and quickly filter by price, living area, rooms and more. There are currently 533 houses in this place within our selection. View also 366 sold houses in Tiel for extra insight into the local housing market.
4001HS Tiel
€ 425.000 k.k.
€ 4.208/m²
4003ZV Tiel
€ 300.000 k.k.
€ 4.478/m²
4003ZV Tiel
€ 290.000 k.k.
€ 4.531/m²
4007LM Tiel
€ 350.000 k.k.
€ 4.487/m²
4007VB Tiel
€ 435.000 k.k.
€ 3.537/m²
4007SJ Tiel
€ 545.000 k.k.
€ 3.633/m²
4005GP Tiel
€ 618.000 k.k.
€ 4.233/m²
4001KZ Tiel
€ 450.000 k.k.
€ 3.383/m²
4001XA Tiel
€ 345.000 k.k.
€ 3.670/m²
4007TN Tiel
€ 329.000 k.k.
€ 4.273/m²
4005EE Tiel
€ 396.000 k.k.
€ 4.500/m²
4001SM Tiel
€ 345.000 k.k.
€ 3.632/m²
4007XM Tiel
€ 498.000 k.k.
€ 3.831/m²
4001NK Tiel
€ 389.000 k.k.
€ 4.420/m²
4001KD Tiel
€ 339.500 k.k.
€ 4.140/m²
4005VR Tiel
€ 329.000 k.k.
€ 5.393/m²
4005JA Tiel
€ 360.000 k.k.
€ 4.675/m²
4001ZM Tiel
€ 350.000 k.k.
€ 3.500/m²
4007VJ Tiel
€ 549.000 k.k.
€ 4.537/m²
4005GG Tiel
€ 398.000 k.k.
€ 3.827/m²
4001HL Tiel
€ 265.000 k.k.
€ 3.442/m²
4007VG Tiel
€ 389.000 k.k.
€ 4.010/m²
4007JG Tiel
€ 425.000 k.k.
€ 4.250/m²
4007JG Tiel
€ 418.000 k.k.
€ 4.222/m²
4001WC Tiel
€ 425.000 k.k.
€ 3.864/m²
4001DP Tiel
€ 465.000 k.k.
€ 3.523/m²
4001DR Tiel
€ 569.000 k.k.
€ 4.626/m²
4001JE Tiel
€ 525.000 k.k.
€ 5.048/m²
Get free quotes from real estate agents with local market knowledge. Compare more than 28 real estate agents in Tiel.
Selling a home in Tiel? View the sales-oriented guide sell a house in Tiel, compare all real estate agents in Tiel or view the top 10 real estate agents in Tiel for extra context to your choice.
Real estate agents make sharper offers when they know you're comparing — ask for quotes for sale or purchase.
Practical answers about housing supply, sales and comparing real estate agents in Tiel.
The costs of a real estate agent in Tiel depend on commission, setup costs, property presentation and the chosen service. Compare the 28 real estate agents in Tiel via the real estate agent page and request multiple quotes to compare rates and approach well.
Within our selection, we are currently showing 533 houses in Tiel. View also the sold houses in Tiel to compare the current offering with recent transactions.
Take into account not only price and living area but also maintenance, energy label, location, outdoor space and sales status. This way you compare houses in Tiel on more than just the asking price.
A local real estate agent knows the neighborhoods, recent transactions and demand in Tiel. By comparing 28 real estate agents in the region you get a better insight into prices, sales strategy and expected yield; the top 10 in Tiel provides a useful starting point.
Yes, when making a sales plan, a valuation in Tiel is wise. You gain insight into a realistic asking price and can then compare offers from real estate agents specifically.
View current location data on residents, WOZ development, housing stock, energy consumption, business activity and safety in Tiel. In 2026 were there 42.493 residents. The average WOZ value in 2025 is EUR 358.000.
These figures help to better assess and compare the housing stock in Tiel with recent sold homes. Orient yourself then on suitable top real estate agents in Tiel for sales advice in this region.
Residents
42.493
Last year: 2026
Average WOZ
EUR 358.000
Last year: 2025
Average income per person.
EUR 32.500
Source: AllNumbers
Crimes (current year)
1.841
Total registered
| Year | Residents |
|---|---|
| 2022 | 42.277 |
| 2023 | 42.604 |
| 2024 | 42.370 |
| 2025 | 42.575 |
| 2026 | 42.493 |
| Year | Average WOZ |
|---|---|
| 2021 | EUR 238.000 |
| 2022 | EUR 264.000 |
| 2023 | EUR 315.000 |
| 2024 | EUR 346.000 |
| 2025 | EUR 358.000 |
Hoger
27
Praktisch
32
Middelbaar
41
Europa
3.963
Nederland
29.505
Buiten Europa
9.107
Label C
4.627
Label B
4.514
Label A
4.005
Label D
1.446
Label G
1.043
Label E
964
Label F
928
Label A+
525
Label A++
334
Label A+++
225
Label A++++
17
Label A+++++
15
| Year | Gas (m3) | Electricity (kWh) |
|---|---|---|
| 2020 | 1.150 | 2.910 |
| 2021 | 1.310 | 2.930 |
| 2022 | 1.020 | 2.740 |
| 2023 | 860 | 2.600 |
| 2024 | 840 | 2.650 |
Hoekwoning
Gas: 940 • Electricity: 2.790
Huurwoning
Gas: 750 • Electricity: 2.030
Koopwoning
Gas: 940 • Electricity: 3.030
Appartement
Gas: 640 • Electricity: 1.800
Tussenwoning
Gas: 800 • Electricity: 2.580
Vrijstaande woning
Gas: 1.390 • Electricity: 4.160
Twee-onder-één-kap woning
Gas: 1.060 • Electricity: 3.070
Total number of company establishments: 5.185
| Period | Crimes |
|---|---|
| jan 2026 | 162 |
| jul 2025 | 155 |
| jun 2025 | 127 |
| mei 2025 | 160 |
| mrt 2025 | 190 |
| mrt 2026 | 124 |
| nov 2024 | 140 |
| nov 2025 | 137 |
| okt 2024 | 190 |
| okt 2025 | 153 |
| sep 2024 | 206 |
| sep 2025 | 194 |
These figures give an indicative picture of safety trends in the living environment of Tiel.
Short answers based on current local statistics, handy for a quick comparison of the living environment.
Tiel telt in 2026 ongeveer 42.493 inwoners.
De gemiddelde WOZ-waarde in Tiel is in 2025 circa € 358.000.
Het gemiddelde inkomen per inwoner in Tiel ligt rond € 32.500 per jaar.
Voor het huidige jaar gaat het om ongeveer 1.841 geregistreerde misdrijven. Gebruik deze cijfers als indicatie en vergelijk trends per periode.
In Tiel komt vooral "Tussenwoningen" veel voor, met ongeveer 7.189 woningen.